
Event organizers often have a difficult time deciding which tournaments they should offer. Is it worth it to add certain weapons? Are there enough people to justify offering various skill levels? Will women show up to the event if there’s a women’s tournament? The numbers seem to indicate that, at least for that last question, there’s justification. But can we provide a little extra certainty around it?
Of course we can.
The Concept
Sean and I had a couple conversations around the idea of a women’s tournament calculator. One of his more glib comments was:
I can add a Scorecard alert: “I notice you have a 40 person longsword tournament, but no women’s. Based on statistical models there is enough interest to support a women’s tournament of 6-12 😉 ”.
While the comment about adding a calculator to Scorecard may have been a little tongue-in-cheek, I decided to see if I could build something that would produce the figures needed to fill in the numbers in that sentence. It would be very interesting to see if providing only the number of mixed longsword competitors to a statistical model would be enough to give an accurate representation of how large a women’s longsword tournament would be. Even better than a statistical model that gives one specific number, Sean gave me the option to use a range of numbers instead.
The Technical Stuff
If you don’t want to know about the math behind the method, feel free to skip this section. However, if you stick around, you’ll get to learn about prediction intervals!
Prediction intervals were the first thing that popped into my head when I saw that I was working with a range of values rather than a specific number. Though the term “prediction interval” may be new, if you’ve had a run-in with stats before, you may have heard the term “confidence interval”. These two things are related quite closely. While I won’t bog you down with the math, I will explain the concept.
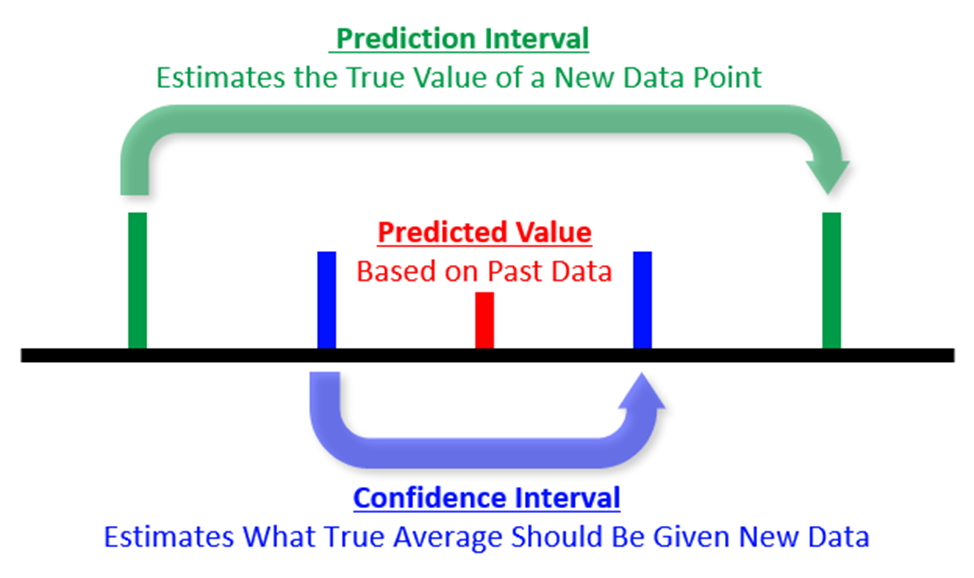
Predictive models are extremely useful tools, and in certain cases, their credibility and usefulness can be assessed through a confidence interval. Regression models will spit out a predicted value when it is given data, and this predicted value will also be given a confidence interval. Usually we deal with 95% confidence intervals, and what these basically say is “This is your predicted value based on past data, and we’re also 95% sure that the true average for this case is between these two values.” A prediction interval is sort of a relaxed version of a confidence interval. The prediction interval tells us the range where the true value of the next prediction should fall.
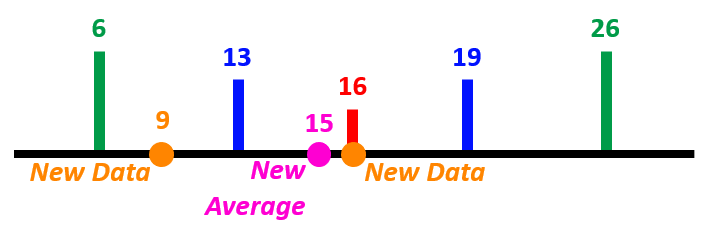
Perhaps it’s easier to explain it with some completely made up numbers. Let’s say that we have a model that predicts how many times someone is going to show up to practice in a month based on how far away they live from the studio. Let’s pretend that we have 5 people who live 10 miles from the studio, and their data shows that these 5 people went to practice 7, 12, 18, 21, and 22 times during the month; a predictive model may take the average of these to say that a new person who lives 10 miles away will come to practice 16 times during the month. This predictive model may have a confidence interval of 13-19, and a prediction interval of 6-26.
To illustrate the confidence interval and prediction interval, let’s say that we have two new students who live 10 miles away from the studio. Let’s pretend that one of the students shows up with the spot-on 16 times that the predictive model outputs, but the other student only comes 9 times. With the addition of these two new data points, the average lowers slightly to 15; however, this new average is still within the 13-19 confidence interval. And even though one student didn’t meet the predicted number of classes, the amount of times they attended class did fall within the prediction interval. Using the same graphic as above:
The Model
This model was built on HEMA Ratings data from 2019-2021. The data had information for 82 events during this timeframe which had both mixed longsword as well as women’s longsword tournaments, and was split into a training and testing data set. The input for the model is the number of individuals in the mixed longsword tournament, and it will give a prediction interval for the number of competitors in the women’s longsword tournament. One key thing to note is that if a tournament had multiple levels of mixed longsword– say, both a beginners’ and open tournament– the input would be the total of both of these tournaments.
Keeping with the color scheme used in the examples from the previous section of red being the model prediction, blue being the confidence interval, and green being the prediction interval, our basic regression model is the following:
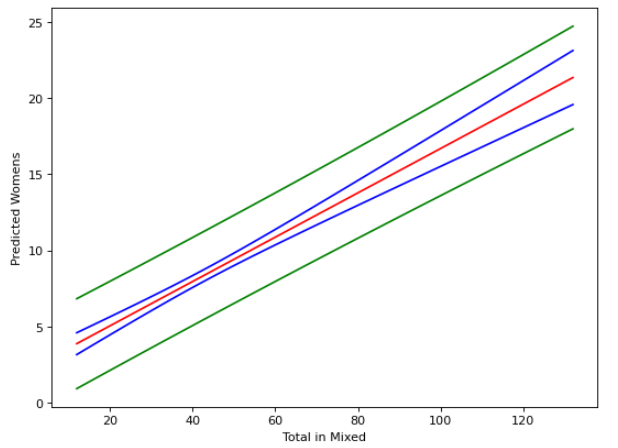
The only part that we are using for estimating the women’s tournament size are the green lines. Plotting the true values of the events with just the prediction interval, we see the following:
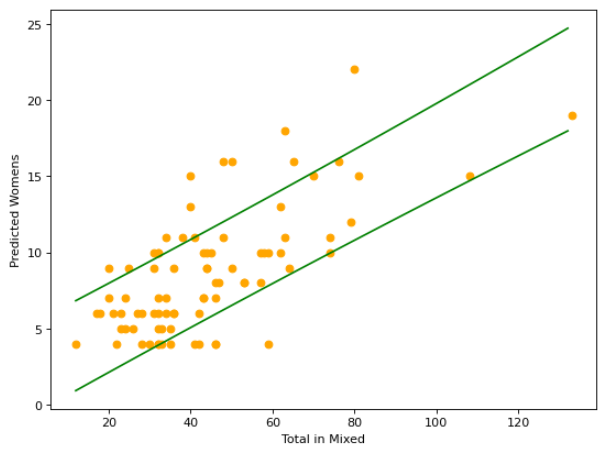
From this graph, we can see that the prediction interval doesn’t always get it right. However the true value of the women’s longsword tournament given the total in mixed longsword does fall within the interval 83% of the time for the entire data set, with it being accurate 81% of the time for just the testing data set.

The equation for the green lines will tell you the range of competitors you can expect in your women’s tournament given an input of the number of competitors in a mixed tournament:

Caveats
There are some things that need to be kept in mind when using this model. Whenever a predictive model is built, it is important that you do not extrapolate. This means that you should not try to estimate the size of a women’s tournament if the number in your mixed tournament is beyond the bounds of the input data. For our model, the smallest mixed tournament was 12 people, and the largest mixed tournament was 133 people. No extrapolation also means that you should not use this model to determine if you should create a women’s division for a weapon other than longsword.
Additionally, if you are capping your mixed tournament at a certain size and it reaches that threshold, you will not know what the natural size of the mixed tournament would have been, thus throwing off the estimates for the women’s tournament. Additionally, if you cap your women’s tournament, you will not know if it could have grown even larger!
So, New Scorecard Feature?
I dunno– web design really isn’t my thing. If you’d like this built into Scorecard instead of having to calculate it with the formula I gave above, heckle Sean about it.
Alternately, if you’re a Python nerd, use this code and enter your mixed tournament size for “x”:
x = 100
y1 = (2.13 + .15*x) - (0.943 * (3.037 * (1+1/55+(x-43.054)**2/21638.836)**.5))
y2 = (2.13 + .15*x) + (0.943 * (3.037 * (1+1/55+(x-43.054)**2/21638.836)**.5))
print(y1)
print(y2)
And Now A Word From Sean:
First of all: Woo, my guess of 40 mixed -> 6-12 women’s was pretty close. The actual numbers based on Kari’s model are 5.6-10.7.
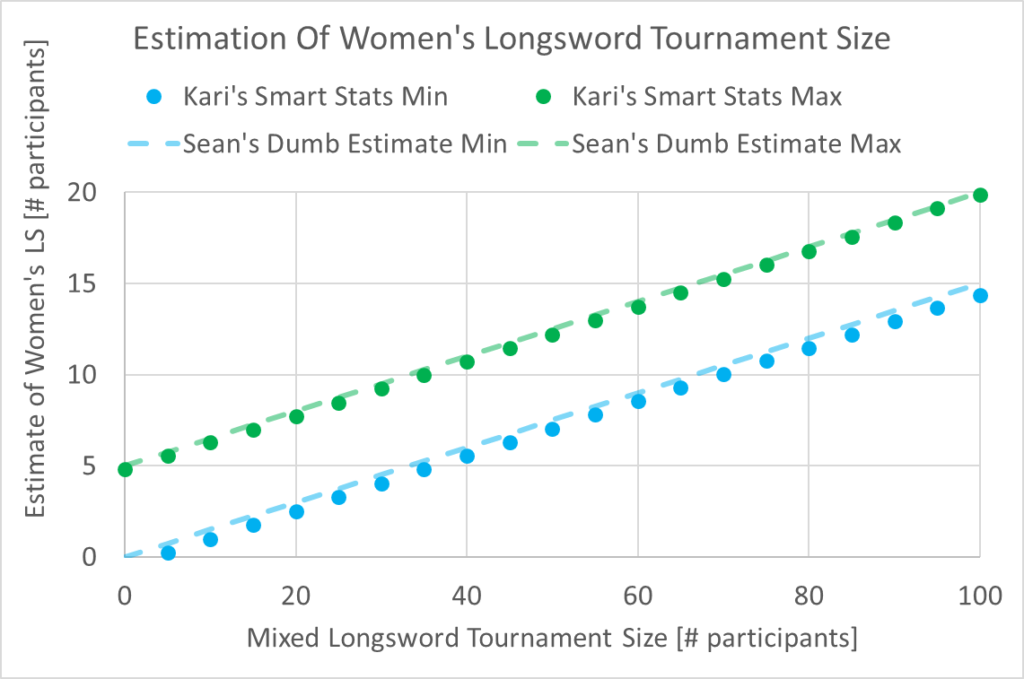
Secondly: If you’re willing to sacrifice some precision and not care about how many fractional participants your tournament will have, we can make an approximation based on Kari’s findings. The linear regression of the min prediction interval is 0.1492 * x – 0.4628, and the max is 0.1508 * x + 4.7228. (Both with R2 values of 0.9999.) Alternatively we can go even simpler and say,
“somewhere between 15% of the mixed tournament, and 15% + 5.”
Which gets us pretty close:
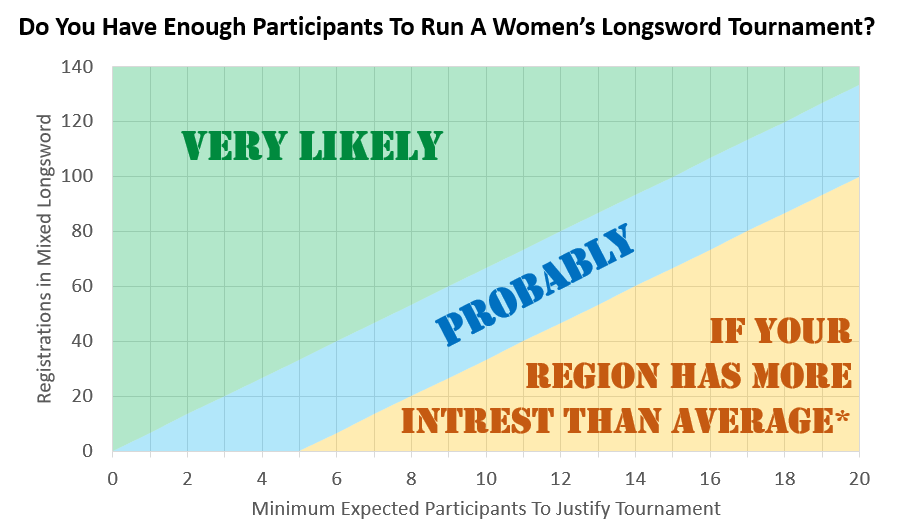
Or, if you want to work backwards, you can decide what the minimum size of a tournament you would consider hosting, and then lookup the number of registrations in mixed you need to be reasonably confident you hit it.