
So, how do you compare HEMA tournaments analytically? We can cross some things off the list right off the bat; some important quantities like “fun” are invisible to cold analytical filters. But even if we are looking at numerical analysis alone, it’s not so straightforward. I’ve been thinking about this challenge for quite some time, and I think I have an answer.
(The nomenclature is that “Event” means the overall event like “AG Open 2023” and the “Tournament” means an individual competition in the event like “Open Longsword”.)
Methods That Don’t Work
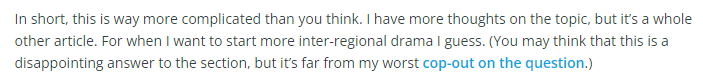
I’ve already touched on the difficulty of answering what seems like a simple question in What Is The Biggest NA HEMA Tournament Of 2022?. The short story is that there are many possible metrics that you could use to evaluate this, and they are all misleading in some way. And in that discussion I also dropped this teaser:
And then did a total cop-out.
But the time to explore this in detail is now! So let’s start with some methods that don’t work,
Doesn’t Work: Event Size
In general there is a trend between bigger events and a higher quality of competition, but that isn’t absolute. If you have a Noobfecht of 250 people it would be the biggest tournament in the world, but would pale in quality compared to L33tfecht which has the 50 top ranked fighters in the world. Obviously not suitable.
Doesn’t Work: Average Rating
The immediate solution most people come up with to address the limitations of evaluating the level of competition at an event is to look at the average ability of the people competing. Which completely solves the problem from the previous section. But that wasn’t a real event, that was an over-exaggerated example to prove a point.

Let’s use a strawman event more suited to explaining this effect. Imagine you have a tournament of 8 fighters all rated “5-stars” on some scale. So the average rating will be 5-stars. But then word gets out, and you have additional 8 fighters showing up all rated 4-stars. From an average point of view this makes the tournament lower level. But adding additional people is always going to make an event harder to win. And I can show it, with math!
Probability Stack Up
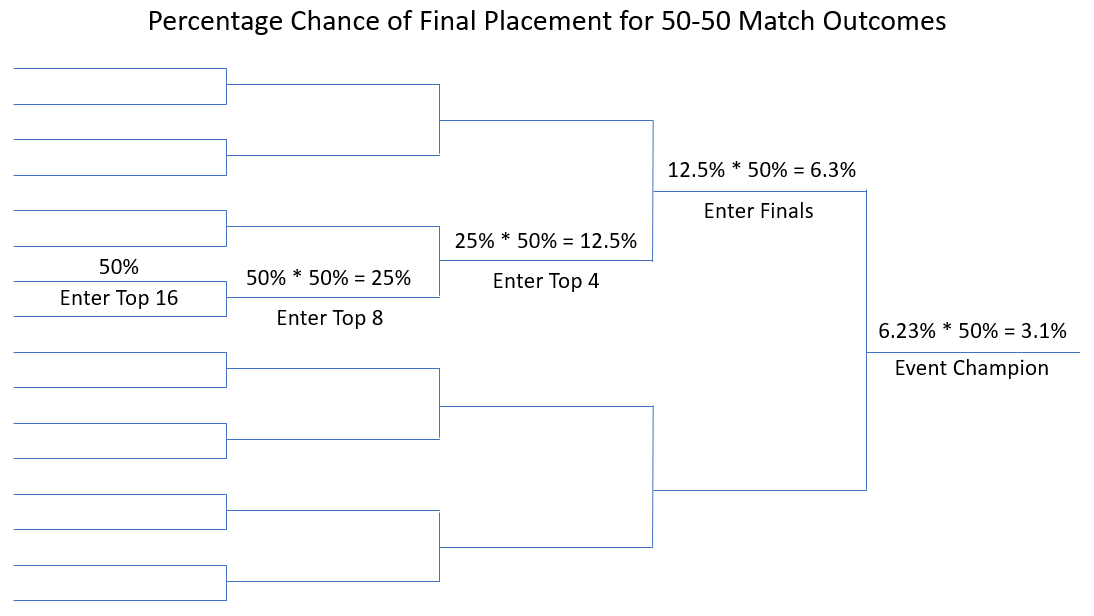
If you are in a 32 person bracket, and everyone has an equal chance of winning a given match, what is your percentage of winning the whole thing? A quick way is just to take 100% and divide it by the 32 equally likely competitors to get a final win chance of 3.1%. The other way is to work it through using a probability stack up, where you multiply the chance of each victory to get to the end.
The 100 % / 32 trick works well when we all have equal odds, but we know that not everyone showing up is equally good. Let’s say that you have 2:1 odds to win every single one of your matches. Which seems like a pretty overwhelming advantage. But once you multiply the probability through, what is the actual chance of winning a 32 person bracket? Try to guess before you check.
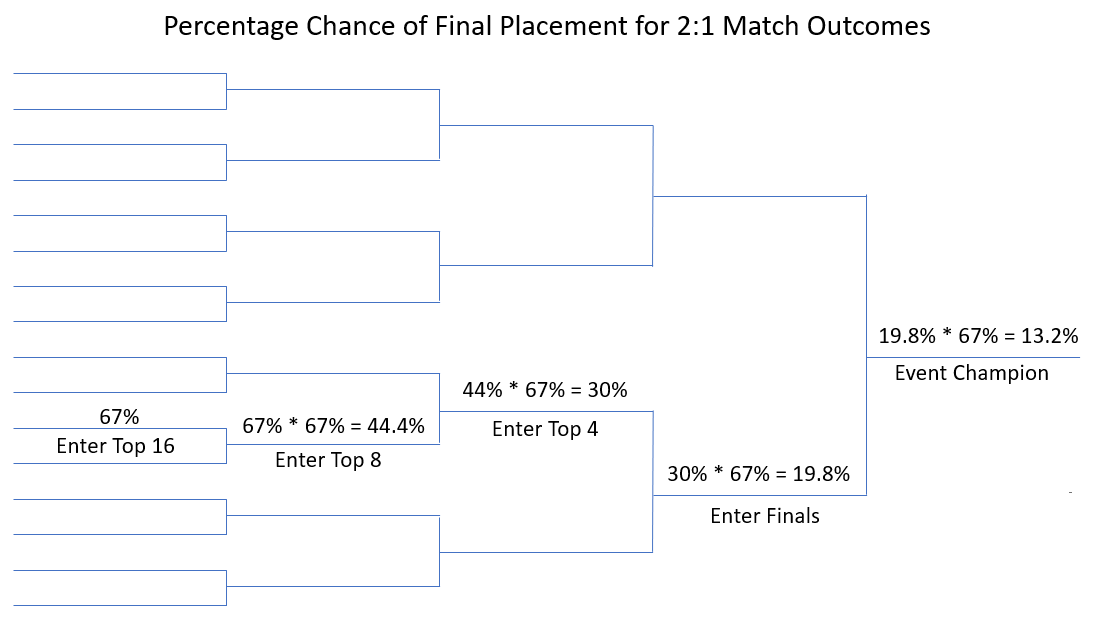
So even a 2:1 match record is only enough to get you a 13.2% chance of winning.
Pseudo-Bracket
The method I’ve ultimately settled on is a pseudo-bracket simulation, as a way to balance both depth of field and quality of competition in a way that produces a rather intuitive final result. Each tier is seeded based on the ratings, however I only go up to the Top-4 (semi-finals) for the purpose of the calculation. This is to not have the whole tournament’s ranking be largely contingent on a single high ranker attending, and instead be influenced by a more balanced view of the top end of the tournament.
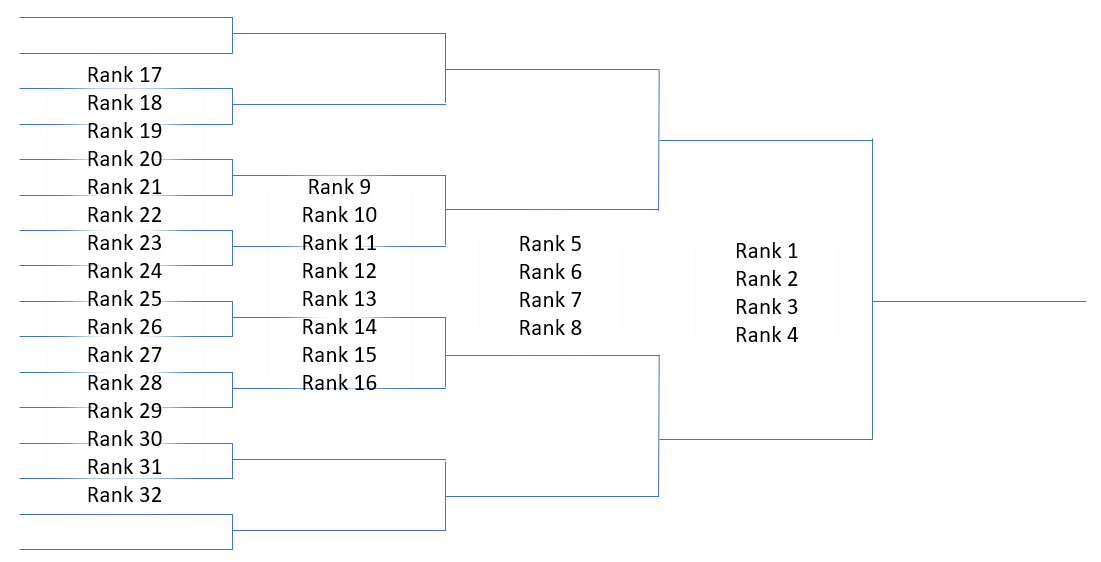
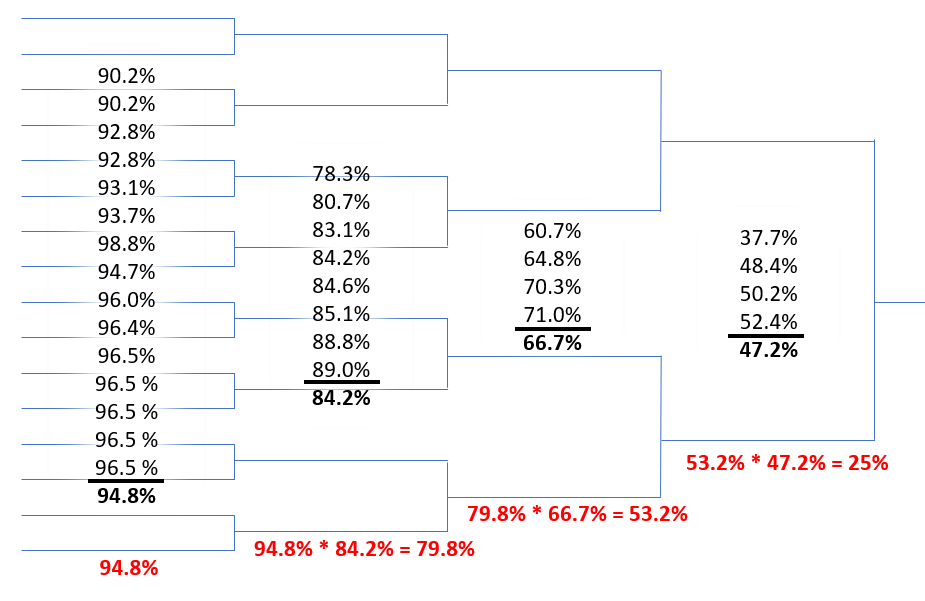
Now that the pseudo-bracket is made, we calculate the win percentage when going up against each individual for a given “Test Rating” we want to compare the tournament against. I’ll populate the bracket below with some percentages to work through an example calculation with.
Example Data:
1844, 1738, 1720, 1698, 1614, 1570, 1506, 1497, 1395, 1356, 1313, 1290, 1281, 1272, 1180, 1173, 1138, 1138, 1039, 1038, 1022, 995, 989 ,936, 845, 808, 800 ,800, 800, 800, 800, 800Using the example data above, and a Glicko-2 derived win percentage formula, let’s run this through with a Test Rating of 1400. (If you want to know more about the win percentage formula, see the Appendix.)
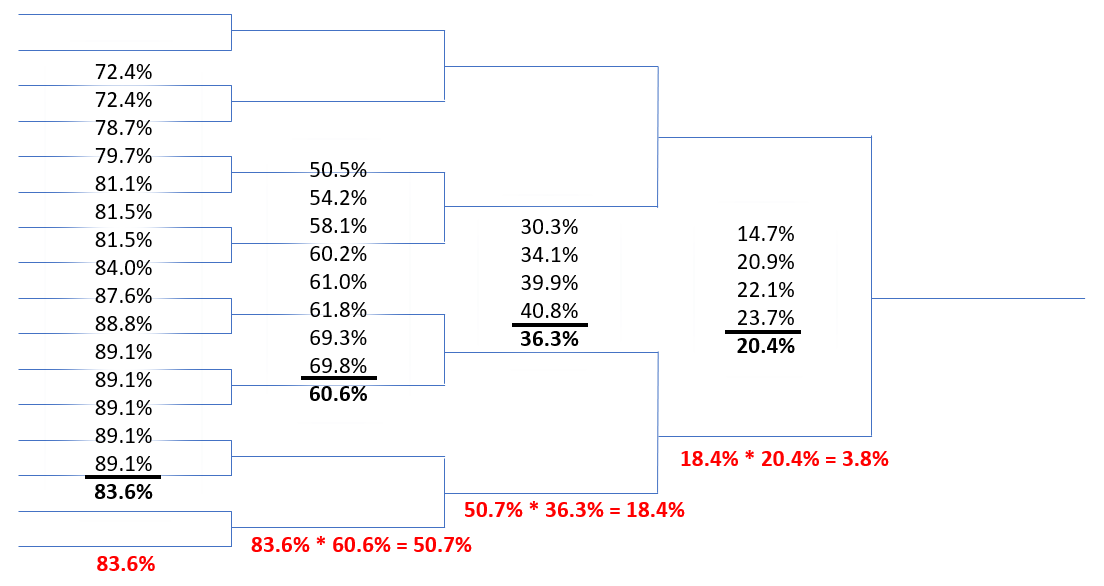
We see that the humble 1400 rated fighter only has a 3.8% chance of making it through the semis in the pseudo-bracket.
Ratings
Now that we have the ability to calculate an event’s win percentage in a somewhat reasonable way, what do we do with it? The answer is we determine some sort of benchmark for “the minimum rating you would need to get a win percentage over some arbitrary number”. And with that said, the PB25 Algorithm* is:
The rating that gives you a 25% chance to advance past the top-4 in a pseudo-bracket of all tournament participants.
What gives this number authority over all other win percentages I could have chosen? Nothing much, it’s somewhat arbitrary. I chose the number so that a tournament of 8 equally rated people will produce a tournament that matches their rating. And when I run numbers through on tournaments the results more or less “feel” right for the overall field.
*Pseudo-Bracket 25% Win Probability
(For reference the example data set I used above ends with a value of 1722. Here is what feeding a value of 1722 into the bracket would look like:)
Tournament Format and Divisions
There is a very specific reason I’ve been calling this a pseudo-bracket when it kind of looks like a real bracket. That is because it’s not representative of the actual bracket that took place in a tournament. It is a statistical representation of the people who attended.
And because this is a statistical tool for looking at attendance, and not a real tournament, the pseudo-bracket is applied identically to all events. Depending on the format of the tournament, the actual win probabilities will almost certainly differ from what a pseudo-bracket would indicate.
Note: For the purpose of this section I’m speaking as if the win probabilities for the real tournament are accurately predicted by the statistical model. This is clearly not always true. It’s for example purposes only, while doing the comparison of pseudo vs actual bracket.
Bracket Format
If you make matches with fewer exchanges you will decrease the probability the better fighter will win, and if you make them longer you increase the probability the better fighter will win. This would affect the overall rating required to have a >25% chance of advancing past the semi-finals in the real bracket. In addition, something like a double-elimination bracket will have a big effect that is not reflected in the pseudo-bracket.
Tournament Tiers
Likewise for the sake of consistency I choose to take all unique competitors in the tournament as a single group. Nowadays it’s common to have tournament tiers, where fighters are split across skill divisions. While it’s mathematically possible to run the algorithm on the tiers individually, the results of this aren’t really helpful when going between events. (Unless they are identically structured and you wanted to do something like compare the Tier-B components to each other.)
Before or After
The other major decision is whether to use ratings from before or after the competition. There are valid arguments based on both, but I have chosen to use the before rating for two reasons.
- If there is a tiered tournament, often someone brand new will shoot up to an extremely high rating if they sweep the lower tier, which would artificially inflate tiered vs non-tiered tournaments.
- More importantly, people like to be able to look at upcoming events and speculate about them, which obviously can only be done with ‘before’ data.
Conclusion
Of course the obvious source for such a rating would be the data in HEMA Ratings. But this method is broadly applicable to any way to want to rate fighters in a tournament. You could have a method where you rate everyone on a scale from 1-10, and it would give you an answer based on the same 1-10 scale.
Unless you’re planning to keep your own pet copy of tournament ratings, the only viable way to do it on an international scale is to use the HEMA Ratings data. Even with all the data biases inherent in the system (see: HEMA Ratings – Does it actually mean anything?, What Can Go Wrong With HEMA Ratings).
But that is a whole other topic.
Stuff For Nerds
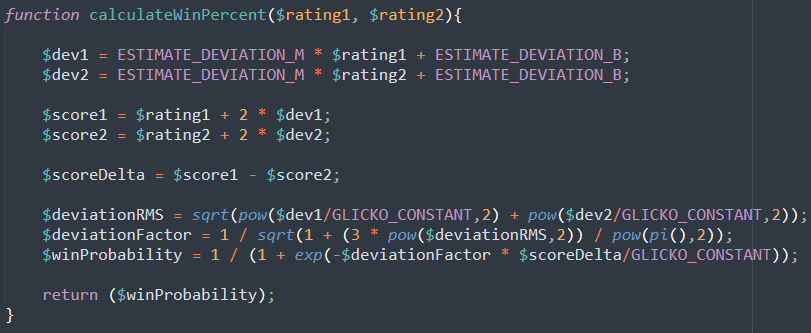
The win percentages I was using in my examples were based on the Glicko-2 algorithm. Glicko-2 is a modification of the ELO method, and is what HEMA Ratings uses. (For the full details you can check out Mark Glickman’s work.)
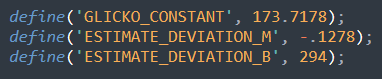
Deviation Estimation
I wanted the PB25 algorithm to work solely on Weighted Rating, as that is what people will see when they open up the page and look at fighters ratings. Which means that rather than use actual deviation scores for individuals, a function to derive it from rating must be determined.
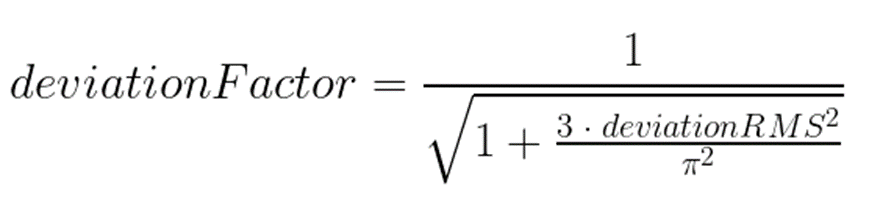
I used the simplest approach: get a data dump of all Weighted Ratings and Deviations, and then do a linear regression. This is only marginally accurate if we want to consider an individual, but that’s ok. What we need it for is as a consistent measure we can apply to every event.
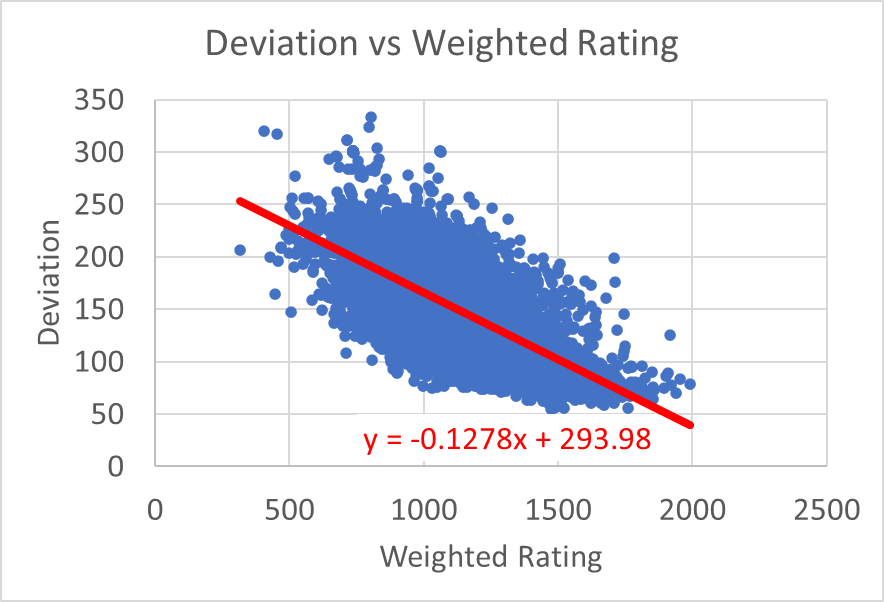
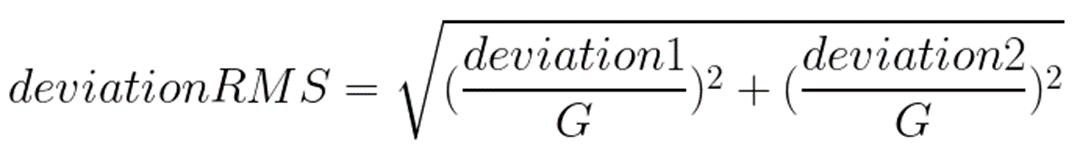
So in the end we arrive at: