

Most people reading this are probably already familiar with HEMA Ratings, but if you’re not it’s probably because:
- You don’t pay that much attention to the online HEMA community, but you still found this article somehow. Neat.
- You are reading this in a distant future where HEMA Ratings no longer exists but Sword STEM somehow still survives. Woo!
In essence, HEMA Ratings strives to give a rating score to fighters based on who they have beaten and lost to in the past. After this, they all appear on a ordered list and people can have fun looking at where they have placed.
This is a good or bad thing depending on how you look at it. From an event organizer point of view, they now have a much greater ability to seed pools and have event cut-offs. On the other hand, having a rating list is more likely to influence people to train for competitions, rather than use competitions as training tools for martial arts.
But that’s way outside the scope of this article. If there is one thing we can say about HEMA Ratings for sure, it’s that it is the largest HEMA data source out there. At the time of this writing, there are 281 Mixed Longsword Tournaments, comprising 3145 fighters over 26270 fights.
HEMA Ratings itself
While you may have opinions about HEMA Ratings, not that many people understand how it works.
- HEMA Ratings gets information from event organizers.
- HEMA Ratings staff start pulling their hair out and losing sleep trying to make sense of what the event organizers submitted, and trying to figure out if Sean Frankin and Sean Franklin are two different people or misspellings of the same person.
- Each fighter’s matches are processed, and their indicator score is adjusted. If they win against someone with a much higher score it moves up a lot, and if they win against someone with a lower score it doesn’t move up as much. If they lose against someone with a higher score it doesn’t go down a lot, and if they lose against someone with a lower score it goes down much more.
- The fighters are then listed on the page in order which becomes the ‘Ranking List’.
Something important to understand is that HEMA Ratings doesn’t rank fighters, it rates them. The rank is just putting all the ratings in order. For instance, the current gap between 1st place and 2nd place is 47.9 points, whereas the gap from 4th to 5th is only 0.4 points.
Bad Ratings
There are some funny abnormalities in the HEMA Ratings list. Fighters who only have a couple tournaments, but get lucky and beat everyone can skyrocket to the top. Fighters who don’t compete often will be rated significantly lower than their actual skill. This isn’t a secret, the HEMA Ratings team is well aware. After all, it’s just numbers in, numbers out. Take a read of the description of the island effect from the HEMA Ratings site:
“Island Effect” is what happens when you have a division with little or no overlap between subgroups.
For example: imagine that there’s a large group of active sabreurs in Norway, South Africa and Australia. All three scenes organize multiple tournaments over many years, but never travel abroad to compete with the two other nations. All scenes have a fighter who sticks out as the best beating everyone else in their country and ending up with a weighted rating of 2000.
The question now is, who’s better, the Norwegian, the Australian or the South African sabre champion? The truth is that without “cross-pollination” between the scenes it’s impossible to know because the three scenes are essentially “islands” in the sea of sabre with independent ratings. It’s possible that they’re equally good, but it’s just as likely that one scene is way ahead of the others, and you can’t know which is which before there’s crossover between the islands.”
The question is: on the whole, is the rating a good indicator of who will win a match?
Accuracy
We start with Mixed/Mens Longsword, because there is the most data for it by far.
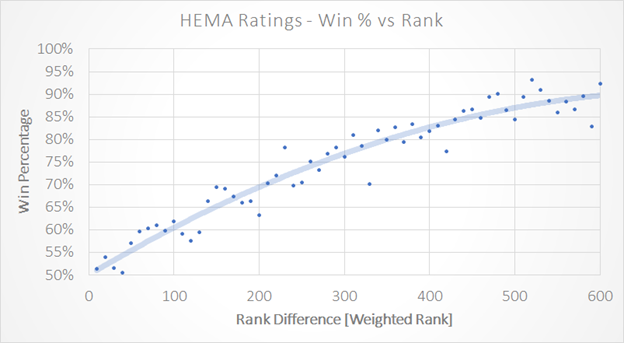
It’s a fairly clear trend, the higher rating difference between two fighters, the more likely the higher rated fighter is to win. Moving out into a 600 point difference, the higher rated fighter is likely to win the match 9 times out of 10.
While that means a lot to a math person (and there are more details for you in the ‘Nerd Stuff’ section at the bottom), what does it translate into when looking at the rankings page? If we take the top 100 fighters as the starting point, and look down the list:
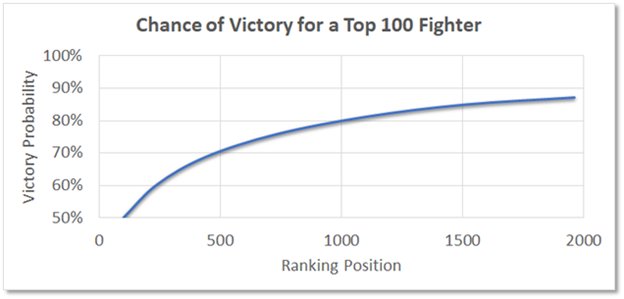
So we can conclude that a higher HEMA Rating is a good predictor of tournament victory. It’s not absolute, as we can see even at the extremes a Top 100 fighter would have a one in ten chance of losing to a fighter ranked 2000th.
And once again, these are general trends. If a fighter has an artificially inflated rating, their chances of losing are probably much higher. If they have a rating that is low because they don’t compete enough, then they will probably also buck the trend. But for the majority of people who compete and travel often, this should be fairly close.
Different Weapons
Mixed/Men’s Longsword has by far the most data out of any weapon set. “How much more?” I imagine you asking.
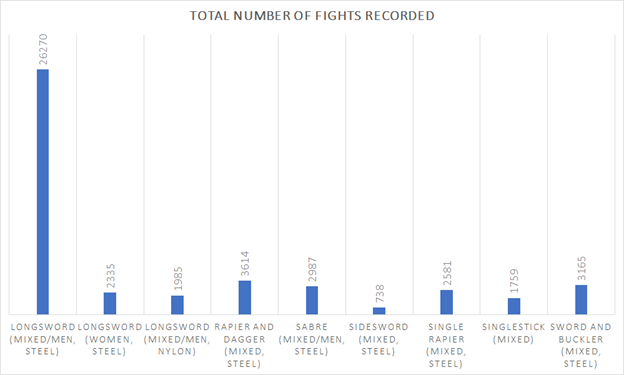
There is just a lot less data for the other weapons, and it’s difficult to get a good baseline for this. But I grabbed a few with a higher number of fights and gave it a try.
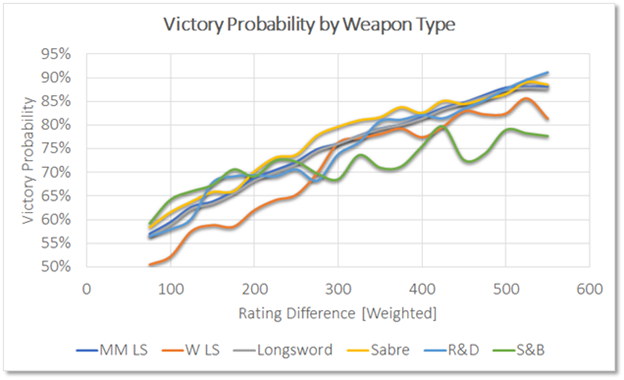
I had to massage and smooth the heck out of this, and those lines are still wavy as hell*. More or less, it shows that the same trends are observed with all weapons. The two main difference:
- The Women’s Longsword rating seems to be less predictive for fighters who are close together in the ratings.
- The Sword and Buckler rating seems to be less predictive for fighters who have large gaps between their ratings.
I have no clue as to why this is, I encourage someone else to take a crack at it.
*Yes, you can massage numbers.
Overall…
Overall, HEMA Ratings is a fairly good indication of who is going to win a match. There is a lot of uncertainty, and being within a hundred placings of a person is often close to a 50:50 chance.
So whatever you think of the methodology, it appears to be doing its job.
Of course I can do this all day (and I kind of did to get these results), but there is so much more to think about. For instance, is the difference between a 1900 and 1800 ranked fighter the same as between a 1500 and 1400 ranked fighter? If the last question seemed exciting to you, can I interest you in:
Nerd Stuff
First of all, if you are here I’m going to assume you have read the whole HEMA Ratings About Section. It explains a little bit about how the Glicko-2 algorithm works, and I don’t feel the need to paraphrase what has already been written there.
This data set is also so big that I can’t post the full data here like I normally do. If you want to do some further work, drop me a line and let’s talk!
Data Processing
When processing the data, I grouped the results into into ‘bins’ of rating differences. eg: I combined all the matches from 20-29 into a single point, to help reduce the noise.
For the Mixed/Men’s Longsword I used a bin size of 10.
For the comparison between different weapons, I increased the bin size to 25, hoping it would be manageable. Not so much. I ended up using a centered moving average on the data, with the two values on each side.
Curve Fitting
While the data has a nice trend, it isn’t the easiest to fit a curve to.
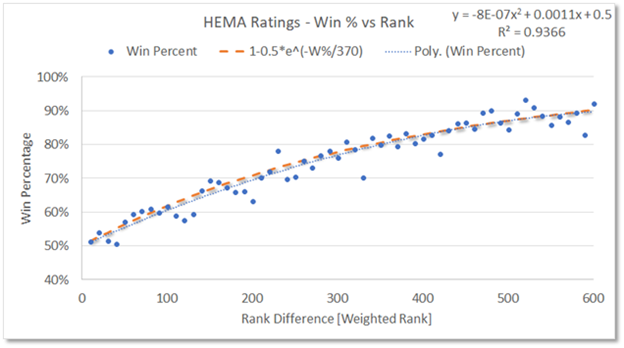
The closest I could get with Excel’s functions is a second order polynomial. This looks really nice, until you remember that this parabola is going to come back down as the rating difference gets even higher. 😉
The dotted orange line is my attempt to fit a curve. An asymptotically inverse exponential between 0.5 and 1.* Using this approach, it tends to err on the high side of the win percentages for fighters who are closer together, and on the low side for fighters who are further apart.
*That might not be the most rigorous mathematical description of the function. Look at the damn graph!
Weighted vs Unweighted Score
A question that arose is, how important is the weighting to the rating?
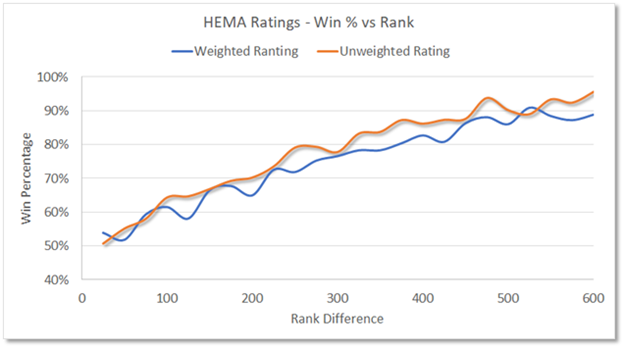
This shows that the curve has essentially been shifted slightly up, indicating that the unweighted rating appears to be an even stronger indicator of victory!
I’m not sure how to explain it. Perhaps the deviation correction is excessive? Which is an interesting conclusion, as there have been plenty of instances of fighters with a relatively low number of fights shooting up to relatively high rankings. And lowering the deviation correction would make this worse.
I don’t have an answer to this, but it was interesting enough to point out.