

My last article was broke down Longpoint from a tournament design point of view. This time we are looking at what actually happened in the longsword tournaments. If you want to know more you can read my previous article (Building the Longpoint Back End) or check the official rules (Longpoint Rules).
Why is it always Longsword? 😠
I know, I know. But we can’t escape the fact that Longsword just has the most data available. At Longpoint there were only two sparring tournaments, longsword and messer. And, unfortunately, I just don’t have enough exchanges from the messer tournament to make it worth investigating. 🙁
Overall Exchanges
So how did the Longsword tournament break down overall? Keep in mind that this data is only for non-control point attacks. Attacks which were awarded control points did not have any target information logged with them, but would have (by definition) needed to target the head or torso.
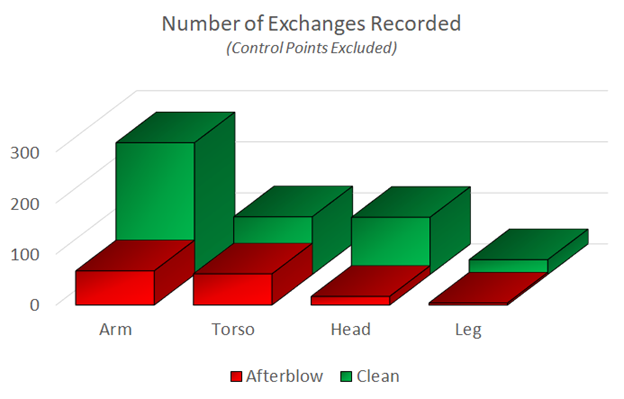
Arms were the most popular target, not a huge surprise
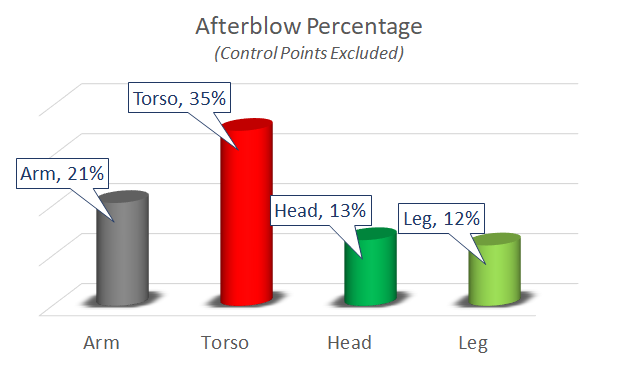
Once again going in deep for the head proves to be an extremely good strategy to not receive afterblows. While this may seem riskier because it is a deep target, time and time again we see that people who strike to the head are have a relatively low risk of getting an afterblow.
But speaking of risky deep targets, torso attacks rear their ugly head again. The afterblow rate against torso attacks is creeping towards three times that of the head. Time and time again we see that the torso is just not an especially safe place to attack*!
Unexpectedly the leg was statistically the least afterblowed target. But this is tempered by the fact that attacks to the leg make up only 5% of all hits thrown, so it is likely that competitors were only throwing them when they felt very confident that they could do so safely. That and the small sample size. One individual competitor threw a third of all leg hits in the whole tournament and only received a single afterblow.
* This comparison becomes even more stark when considering the stopping power of sharp blades. The torso has much more mass than the head or arms[citation needed], and requires a waa-aay stronger cut to inflict wounds that will inhibit an opponent’s ability to fight. Thus attacks to the head and arms are also more likely to physically remove the opponent’s ability to deliver an afterblow, further magnifying this trend.
Deep Targets
Some individuals expressed concerns that the tournament format encouraged people to simply stay at range and snipe, so as not to expose themselves to afterblows which would tank their indicator score.
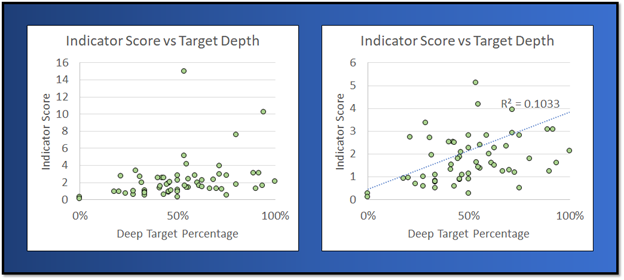
This data clearly shows that going for deep targets was not something that negatively impacted people overall. That said, there wasn’t a particularly strong trend with going deep helping a significant amount either. The only other caveat to consider is that in this case ‘deep target’ means all hits to deep targets, including the unsafe cut to the torso. If we were able to remove the torso cut data the relative safety of going for deep targets would, in all likelihood, become more noticeable.
Moral of the story: go deep and attack the head. It’s the safest play. (Hmm, I wonder if we have a historical source on that….)
Tournament Trends
This is what is called a correlation plot. It essentially illustrates how much two things are related. The stronger color something is, the more the two are related. ±100 means they are completely in synch.
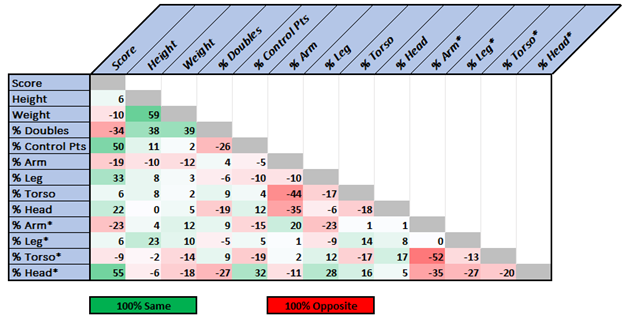
It’s intuitive that people who score more control points tend to have higher scores. Or people who have higher scores tend to score more control points. (It doesn’t say anything about what causes what, or if both measurements are caused by a third thing. This is an important thing to keep in mind if you are trying to draw conclusions.)
On the equally intuitive side we can see that doubles and score are negatively correlated. People who double more tend to have lower scores. But that certainly isn’t always the case. In the past when I’ve run data there was actually no correlation between winning matches and doubling less. So that is a win for the Points Scored / Times Hit ranking method. Clearly I need to take the data from a single tournament as definitive and pat myself on the back for being great at algorithm design.
Height / Weight
People who are taller tend to weigh more. Shocking!
Though what is interesting is that there is a correlation between people being taller and doubling. And there is also a correlation between people being heavier tending to double more. Guys*, you aren’t doing enough out there to shed the brute stereotype!
*I usually use non-gendered language because I am dealing with abstract statistical groups. But considering I’m now talking about a select group that is a) tall, b) heavy, c) in HEMA tournaments, there is a good chance we have statistically narrowed to a group with exceedingly few or no women. 😉
Doubles
Last correlation I found interesting: people who double more are less likely to get control points, or to target the head. Once again, I would like to reiterate my earlier remarks about targeting the head being the safest thing you can do.
People who double more also tend to get hit in the head less. Is this because they happened to be in matches where neither party was going for the head, thus creating a more doubly environment? Was it because they didn’t engage as deeply? Something else completely? With this data we have no way of knowing.
Pool Balance
One of my concerns with the pool sorting by height and weight is it could lead to a large skill disparity in the pools. (If you don’t know what I’m talking about you can take my earlier advice and read Building the Longpoint Back End). And I was more or less correct.
I used the HEMA Ratings data as an approximation for pool strength. While we all know that HEMA Ratings certainly isn’t a full picture of every fighter. But if you zoom out and use it on a statistical basis it proves to be fairly accurate. (HEMA Ratings – Does it actually mean anything?)
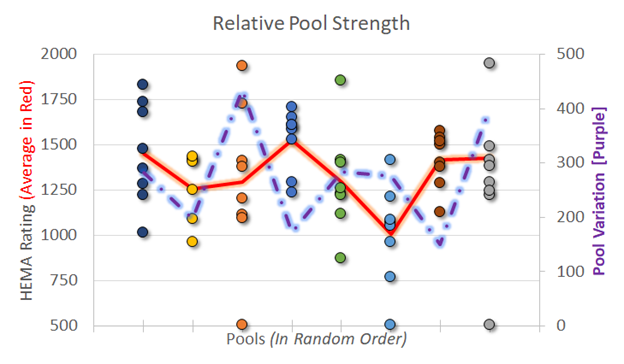
I’m guessing that these numbers probably don’t mean a lot to most of you, so let’s get some perspective as to how much of a of a rankings spread we are talking about. At the time of this writing, going from a HEMA Rating of 1527 (the average of the highest pool) to 1320 (the overall average) is the equivalent of going from 266th place on the ranking list to 888th place. Going from the highest rated pool to the lowest rated pool is (approximately) the equivalent of dropping from 250th to 2500th. That is a huge spread.
And differences could be even worse depending on which individuals a person was matched up with in a pool. Two pools had fighters at the extreme ends of the spectrum, very high and very low. Depending on who you drew for matches you could be very lucky, or very unlucky!
Stuff for Nerds
In the end we can’t draw too many conclusions from this–it’s primarily more information to add to the growing corpus of knowledge about HEMA analytics. If anyone else has alternative takes on the data, I would love to hear them!
Overall Exchanges
- Naturally the number of afterblows against the head and torso would change if I had accurate counts on control points.
- Unfortunately the number of thrust/cut attacks against the torso are not separated out. Based on data from other events I think it would show that the cut to the torso is far more likely to receive an afterblow than a thrust would have. Also I assume that the vast majority, if not all, control points to the torso were from thrusts.
Tournament Trends
- This was the result of me throwing everything in and doing an R2 correlation on the data set. Naturally the numbers are all multiplied by 100 to make them easier to read for non-stats people.
| Target | % Overall | Afterblow | Clean | % Afterblow |
| Arm | 45 | 67 | 258 | 21% |
| Torso | 5 | 61 | 113 | 35% |
| Head | 24 | 17 | 112 | 13% |
| Leg | 18 | 4 | 29 | 12% |
| Total | 149 | 512 | 23% |
| Score | Doubles | Control Pts | Arm | Leg | Torso | Head | Arm* | Leg* | Torso* | Head* |
| 15 | 5 | 4 | 3 | 2 | 1 | 1 | ||||
| 10.2 | 3 | 1 | 3 | 9 | 1 | 3 | 1 | |||
| 7.57 | 7 | 3 | 2 | 3 | 3 | 1 | 1 | 1 | ||
| 5.13 | 1 | 5 | 7 | 1 | 2 | 3 | 1 | 1 | ||
| 3.95 | 5 | 4 | 3 | 1 | 3 | 4 | ||||
| 3.36 | 6 | 9 | 3 | 3 | 2 | 3 | 1 | |||
| 3.08 | 2 | 4 | 1 | 5 | 2 | 1 | 2 | 3 | ||
| 2.92 | 1 | 2 | 4 | 5 | 3 | 4 | 2 | 1 | ||
| 4.17 | 1 | 2 | 6 | 4 | 8 | 2 | 5 | 1 | 4 | |
| 2.82 | 2 | 1 | 12 | 7 | 4 | 2 | 7 | 1 | ||
| 2.81 | 1 | 5 | 7 | 4 | 1 | 3 | 3 | 4 | ||
| 2.27 | 3 | 3 | 2 | 4 | 1 | 2 | 1 | |||
| 2 | 2 | 4 | 1 | 3 | 1 | |||||
| 1.24 | 3 | 5 | 1 | 5 | 3 | 2 | ||||
| 2.53 | 3 | 3 | 10 | 1 | 3 | 2 | 3 | 1 | 2 | 1 |
| 2.33 | 2 | 6 | 6 | 5 | 4 | 3 | 3 | 3 | ||
| 1.87 | 5 | 2 | 6 | 2 | 1 | 2 | 1 | 1 | ||
| 1.79 | 1 | 2 | 8 | 1 | 6 | 4 | 3 | 5 | ||
| 1.61 | 1 | 6 | 3 | 8 | 15 | 1 | 2 | 1 | ||
| 2.8 | 1 | 2 | 2 | 4 | 5 | 1 | 1 | |||
| 2.7 | 1 | 1 | 7 | 1 | 2 | 1 | 4 | 1 | 1 | |
| 2.53 | 5 | 1 | 15 | 6 | 3 | 6 | 1 | |||
| 1.6 | 4 | 2 | 1 | 3 | 8 | 9 | 4 | 3 | ||
| 1.38 | 4 | 4 | 2 | 4 | 2 | |||||
| 1.32 | 4 | 2 | 13 | 5 | 2 | 11 | 7 | 3 | ||
| 2.5 | 5 | 10 | 2 | 4 | 5 | 1 | 3 | 2 | 2 | |
| 2.27 | 6 | 3 | 4 | 3 | 5 | 1 | 1 | |||
| 1.5 | 2 | 3 | 6 | 2 | 5 | 7 | 6 | 4 | ||
| 1.42 | 4 | 2 | 4 | 1 | 3 | 1 | 4 | 2 | 2 | |
| 1.12 | 2 | 7 | 1 | 4 | 10 | 1 | 3 | 4 | ||
| 3.07 | 1 | 2 | 2 | 6 | 8 | 5 | 1 | 2 | 3 | |
| 2.73 | 3 | 1 | 19 | 3 | 1 | 7 | 2 | 1 | ||
| 2.07 | 2 | 2 | 5 | 2 | 1 | 3 | 2 | 1 | 7 | 2 |
| 1.07 | 2 | 3 | 3 | 1 | 2 | 5 | 2 | 2 | ||
| 0.94 | 1 | 8 | 2 | 9 | 2 | 2 | ||||
| 0.86 | 2 | 6 | 4 | 1 | 7 | 2 | 3 | |||
| 1.78 | 3 | 4 | 3 | 4 | 4 | 8 | 3 | 3 | ||
| 1.64 | 2 | 5 | 5 | 1 | 1 | 6 | 3 | 4 | ||
| 1.52 | 1 | 9 | 1 | 5 | 2 | 8 | 3 | 2 | ||
| 1.25 | 4 | 1 | 7 | 2 | 4 | 1 | 5 | 2 | ||
| 0.9 | 2 | 1 | 6 | 1 | 3 | 4 | 5 | 1 | ||
| 2.4 | 2 | 1 | 5 | 2 | 1 | 2 | 1 | 4 | 2 | |
| 2.12 | 2 | 2 | 2 | 1 | 2 | 1 | 4 | 1 | ||
| 1.94 | 2 | 1 | 6 | 1 | 3 | 7 | 1 | 2 | 1 | |
| 0.68 | 4 | 13 | 3 | 1 | 13 | 2 | 6 | 4 | ||
| 0.59 | 7 | 2 | 1 | 15 | 2 | 4 | ||||
| 0.58 | 3 | 1 | 4 | 2 | 12 | 5 | 1 | |||
| 1.29 | 1 | 3 | 2 | 3 | 5 | 4 | 1 | |||
| 1.08 | 1 | 1 | 3 | 3 | 14 | 1 | 4 | |||
| 0.91 | 7 | 3 | 1 | 1 | 6 | 2 | ||||
| 0.9 | 1 | 1 | 3 | 1 | 2 | 3 | 2 | 7 | ||
| 0.76 | 3 | 4 | 1 | 2 | 6 | 1 | 2 | 1 | ||
| 1.19 | 4 | 3 | 5 | 3 | 10 | 4 | ||||
| 1 | 5 | 7 | 1 | 3 | 5 | 5 | ||||
| 0.82 | 2 | 1 | 6 | 2 | 4 | 1 | 4 | 6 | ||
| 0.5 | 1 | 1 | 4 | 2 | 1 | |||||
| 0.27 | 4 | 4 | 5 | 1 | ||||||
| 0.27 | 2 | 2 | 2 | 2 | ||||||
| 0.78 | 5 | 3 | 3 | 4 | 5 | |||||
| 0.5 | 1 | 3 | 6 | 4 | 7 | |||||
| 0.1 | 1 | 2 | 6 | 6 | 4 |