

I saw some graphics floating around Facebook a while ago showing the geographical location of top-rated HEMA fencers. These graphics, created by J.J. Conlon, showed fighters with a 1400+ HEMA Ratings for mixed and women’s longsword fencers by state, as well as the change in top mixed longsword fencers over time by state. I decided to take this a step further and replicate this view over time for all weapon sets that are rated on HEMA Ratings, as well as add in a Top 100 view.
The Viz
Shown here is a screenshot of the visualization that has been created in Tableau. To access the interactive visualization, visit this URL:
www.tinyurl.com/Top-US-HEMA-fighters
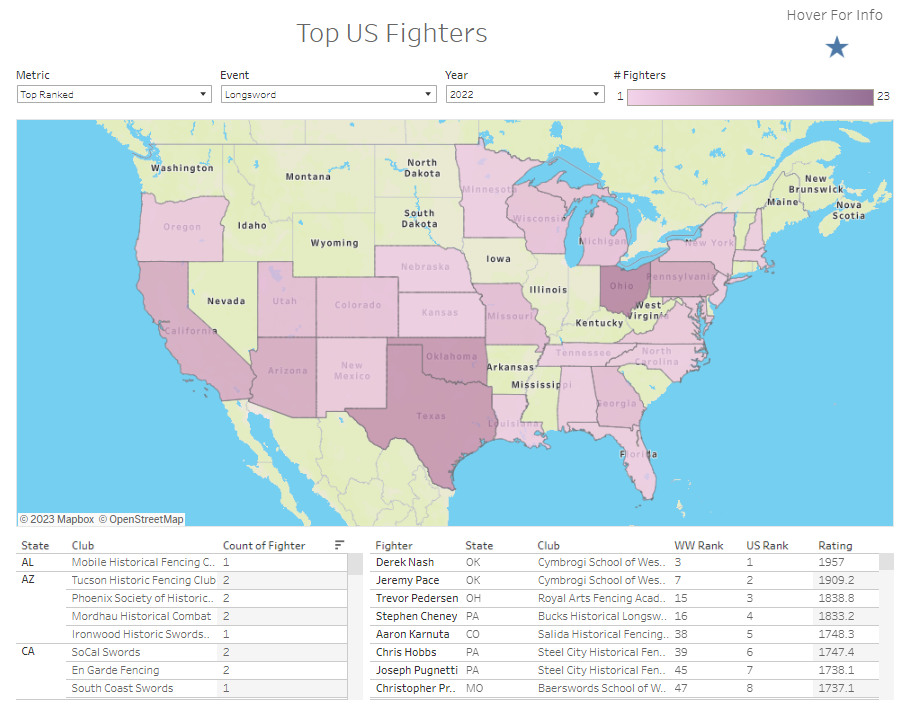
This visualization provides the dropdowns Metric, Event, and Year. Metric allows you to pick between viewing either fighters who have a 1400+ Rating or the Top 100. Event allows you to choose through all the different types of weapons rated on HEMA Ratings (excluding Sidesword and Nylon Longsword as there is not enough data for meaningful visualization). Year allows you to look at data as far back as 2015 for many of the weapons (certain weapons do not have enough fighters that far back for a decent sample size).
About the Data
The data shown here was pulled from HEMA Ratings in November 2022 by hand. Because this was pulled by hand, there is a possibility of making a mistake, so please let us know if there are any errors. Each year of data is calculated based on the November data for that particular year.
There may be several reasons why fighters are not included in this visualization. The first is that only fighters with an American flag next to their name in HEMA Ratings are included; this excludes some fencers who may be currently located in the US but identify under another nationality. Fighters who do not have a school listed or whose schools have locations in multiple states are not included as it is difficult to geographically place them. Additionally, fighters may have changed schools and/or states over time, but they will be counted toward their school designation as of November 2022 for all years because HEMA Ratings does not keep historical data for fighters’ clubs. Lastly, only fighters with a Green or Yellow thermometer next to their name for a given year are included; this is to make sure that inactive fighters or fighters with extremely limited data are not included.
This map is also only intended to show top talent. Some combinations of weapon and year do not have a full 100 competitors. As such, the view for “Top 100” may be reduced to a smaller number. For example, if there are only 68 fighters for a particular category one year, the number of fighters shown may be reduced to 30.
Future Work
This map may be used to inspire future articles. If anyone has any suggestions on how this can be analyzed, please let me know and I will do my best to look at things!
History Lessons
Hi, all. Sean dropping in for some fun HEMA history as you flip through the map. Kari’s tool is the star of the show here, but we’re not going to have you go home empty handed without some sort of article content.
2015
We start our journey in 2015, which is less than a decade ago in real time, but several eons in HEMA time. In this far-away land there was no such thing as HEMA ratings, and almost no events used tournament management software. HEMA CM had been adopted in the Nordic League, and HEMA Scorecard debuted in a few of the larger western North American tournaments.
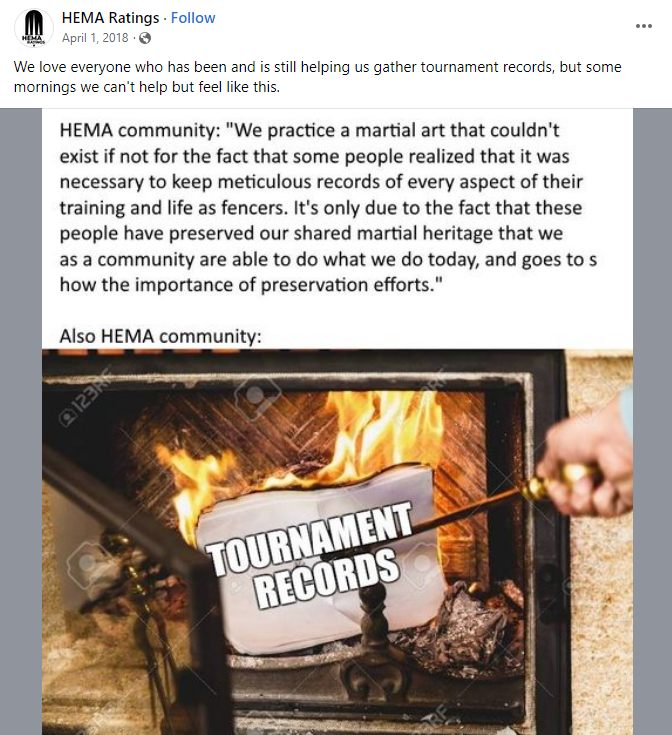
Given that HEMA Ratings didn’t exist back in 2015, why are there ratings? That is because HEMA Ratings needed to start with something, and tried to pull archived information from as far back as they could get. Which is why you see the ratings dominated by the West Coast (data in HEMA Scorecard), Texas (using HEMA CM), and the capital region. Because Ben Jarashaw kept amazing quality records from tournaments archived.
States on the map: 22
2016
In 2016 you see the same trends exist, however slightly more dispersed. During 2016 HEMA Ratings was getting quietly set up in the background and was trying to collect all the data they could. (I was first asked for data in April of 2016). So though it would be almost a year until HEMA Ratings launched, they had a much better time of collecting records as events were happening, rather than hoping someone had kept some records in the archive.
States on the map: 26
2017
Wooo, HEMA Ratings debuts in February. Other than that we don’t see a ton of change in these distributions, mainly that the areas adjacent to the “originally” highest rated regions are getting more and more higher rated fighters. Which is a product of both skill growth (across the board for everyone) and more events.
States on the map: 25
2018
This would be the first “post Longpoint” year, given that Longpoint was the event that had kind of grown up with the burgeoning North American HEMA scene and represented the peak of professionalism. The bias away from the coasts is growing, but only in a way that becomes apparent through my 20/20 hindsight.
States on the map: 26
2019
2019 is quite possibly the most “even” seeming years, without significant standouts. In addition we see the traditional East Coast belt broken up, without a solid region of states between Florida and Maine.
States on the map: 26
2020
Did this year happen?
2021
Coming out of Covid tournaments was far from full swing in 2021. What we see here is a big pickup in the central US, with a combination of (a) these tournaments tending to start back up again in 2021 vs 2022 for a lot of the traditionally ‘big’ events, and (b) just more tournaments being offered in the central US.
It’s also, given 2020 isn’t real, the first time we get to see all the represented states be contiguous. (Also connecting the whole USA through the Mackinac Bridge in Michigan would have felt like a real cop-out.)
States on the map: 28
2022
The trend we saw coming out of covid is continuing, with an abundance of competition in the Ohio/Texas/Oklahoma region being reflected in the map. Who knows what trends are forming that look like random noise now, but will be part of a convincing narrative when written about a decade in the future.
States on the map: 28