

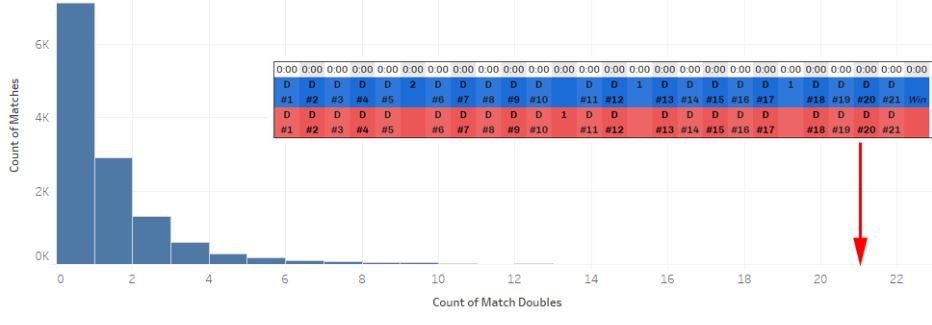
Doubles. Whatever your stance on them, we can all probably agree that in a majority of sparring cases, they are not ideal. They score you no points and, in some tournaments, can even cause you to outright lose a match if you do it enough. In case you aren’t familiar with doubles, let me take a moment to explain this action. A double occurs in sparring when both fighters land a strike on each other at approximately the same time. This may not seem like such a bad thing to the uninitiated spectator; it very much just looks like “Oops! We tied!”. Below is an image of the so-called “tie”.

Kinda looks like both people lost, doesn’t it? The general idea is that you should be keeping yourself safe from strikes by using various guards, cuts, and footwork, even while you are on the offensive. This is why doubling is generally frowned upon– quite literally, too, if you look at HEMA Scorecard.
Given that doubles are often not a great thing, I decided to see if I could build any model that would accurately predict doubles. I tried talking with Sean about it, but he told me he’s tried and it can’t be done. But Sean isn’t a data scientist, is he?
This predictive modeling exercise uses data from HEMA Scorecard, but there are some things to keep in mind about what limitations this data has, as well as what self-imposed restrictions I’ve placed on the data:
- HEMA Scorecard data is only as good as the person entering the data. If the data entry is bad, then the predictive models may suffer. Garbage in, garbage out, as they say.
- Events do some screwy things when they use Scorecard or may impose weird rule sets. Some tournaments only record the final score in Scorecard rather than each exchange. Some events allow someone to win after the first point is scored. Some events don’t put doubles into Scorecard at all. This analysis removes any events which recorded zero doubles across all matches and have fewer than 3 exchanges per match across all matches.
- This analysis is limited to pool events. There are many different reasons why you would want to limit to pools, such as the population of pools being different from eliminations and the consequences of doubling are different, but it’s mainly because I’m lazy and don’t want to figure out Scorecard elimination bracket data.
- One variable in the model is for Double Out Tournaments. This can be pretty hard to determine, so I’ve relied on Sean’s expertise. He is good at some things involving data cleaning, even if he is an engineer.
- Certain event types have multiple designations in Scorecard. Some of them aren’t labeled at all. Because 5 Rapier categories is a bit excessive, they are all classified simply as “Rapier”. There’s a similar grouping for Sidesword. If a tournament does not have labels, I’ve made some assumptions. If a tournament does not have a skill level, I’ve listed it as “Open”. If gender was not specified, I categorized it as “Mixed”.

The things we are going to try to predict are:
- Count of doubles in a tournament
- Percent of doubles in a tournament
- Count of doubles in a match
- Percent of doubles in a match
Percentages are determined by taking the number of doubles divided by the number of strikes with clean, double, and afterblow counting as strikes.
Keeping these things in mind, let’s get rolling with the fun stuff.
The Data
As mentioned, the data we are using comes from HEMA Scorecard. After filtering out everything discussed above, we are left with information on 12,772 matches from 277 tournaments at 80 events. When creating predictive models, it is a good idea to have training and testing data sets. The training data set is what the algorithm will use to build the predictive model, while the testing data set is used to validate the model; this is to see if the model can perform well on unseen data. Therefore, the data was split into training and testing sets, with 67% of the data belonging to the training set.
The following are the variables that are being used for the tournament-level analysis:
| Average # Fighters Per Pool | Average # Pool Matches | Total # Pools |
| Total # Fighters In Tournament | Total # Tournament Matches | Double Out Tournament |
| Longsword | Messer | Rapier |
| Saber | Sidesword | Singlestick |
| Sword and Buckler | Beginner’s | Intermediate |
| Open | Advanced | Mixed |
| Women’s |
In addition to the above variables, we also have these variables that we can use for the match-level analysis:
| Pool Number | Match Number | # Fighters In Pool |
| # Pool Matches | Max # of Current Wins Between Two Competitors | Min # of Current Wins Between Two Competitors |
| Max # of Previous Matches Between Two Competitors | Min # of Previous Matches Between Two Competitors | Sum of Previous Matches of Two Competitors |
| Back-to-Back Match for One Competitor |
One thing that you will notice about these variables is that they can all be obtained before the tournament match begins. A predictive model relies on variables that you can collect before the tournament or match takes place instead of using data that is conditional on things happening during the tournament or match.
If you’re thinking to yourself, “Some of these variables seem highly correlated”, you would be correct. Highly correlated predictor variables can do some wonky things with models, but I promise I take care of it during my processes; I’m not going to go into the details, though.
First Step: Regression Modeling
If you have read my previous article here detailing all the information about the most common types of predictive models, you will know that regression modeling is the first step pretty much everyone takes when doing modeling.
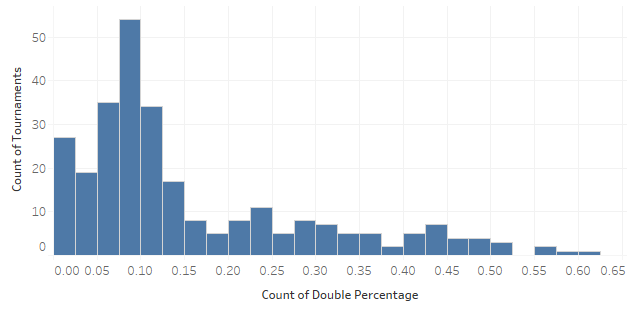
Let’s first check our tournament-level data to see what the distribution looks like:
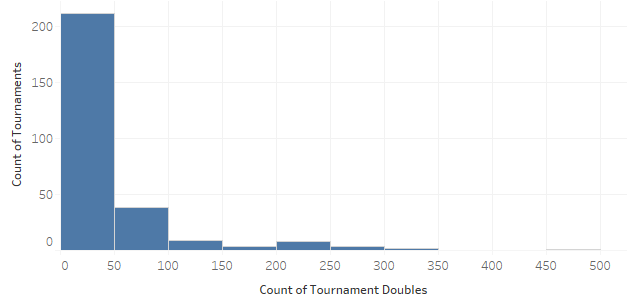
If you remember my previous article, you might recall that this looks somewhat like a Poisson distribution. Therefore, since we have count data for the first graph, we should try a Poisson regression model Throwing our counts data into a Poisson regression model, the following pops out:
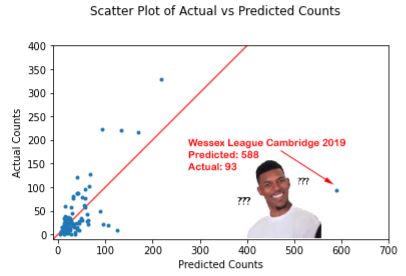
Yeah, this really isn’t predicting things very well. If this model had good predictive power, we would see the blue dots falling perfectly on the red diagonal line. So it looks like regression modeling isn’t going to get us there for finding tournament-level counts or percentages.
Let’s repeat the process for match-level counts and percentages. Again, we’ll start with some histograms to get an idea of the data’s distribution:
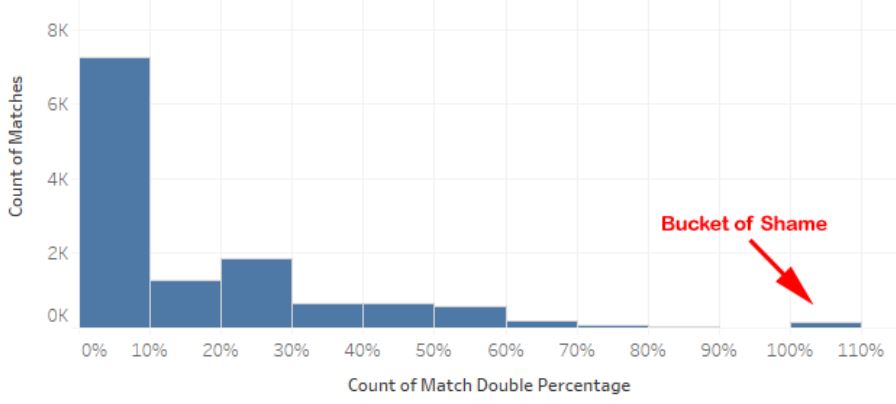
Once again, we can notice that our counts data looks Poisson-distributed. So you know what we are going to do next!
| Side Note: Don’t fall into the “Bucket of Shame” where 100% of your match exchanges are doubles. There is no Razzies equivalent for HEMA. |
And, again, we see that the Poisson regression on the counts doesn’t really inspire confidence in its predictive abilities:
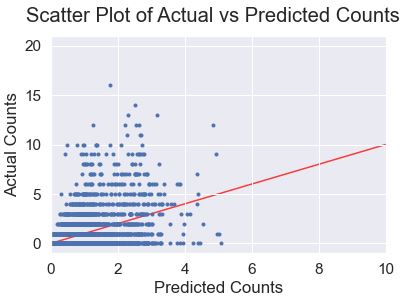
One interesting takeaway from this graph, though, is that the model does not seem to do well at predicting high counts of doubles– in fact, it doesn’t seem to classify any match as having above 5 doubles.
Trees, Trees, and More Trees!
After regression comes decision trees and random forests! Once again, if you read my previous article, you will already be familiar with decision trees as well as the concepts behind random forests. Basically, a random forest is a group of decision trees that make splits at different points, and these various decision trees are used as an ensemble model. However, you might be wondering how we can use decision trees and random forests on this data because it is numerical data, not categorical.
Decision trees can work with numerical data as well; in these cases, they are called regression trees. They work very similarly to the standard decision tree in the way they create their rules, but their splits are based on values that are above or below the split point, and the value at the terminal node of the tree is the average of all the observations that end at that node from the training data set.
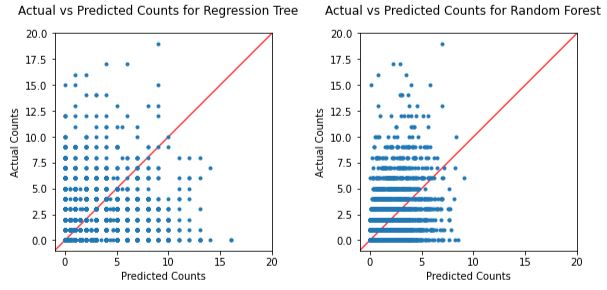
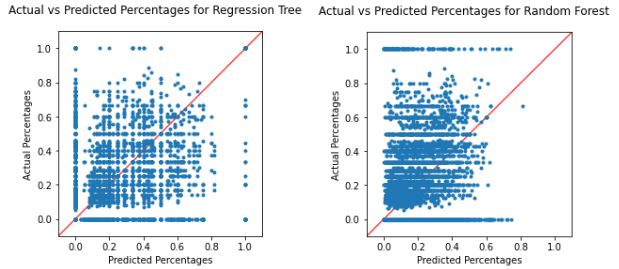
First we will do regression trees as well as random forests on the tournament-level data. Here is what our decision trees show for predictive ability:
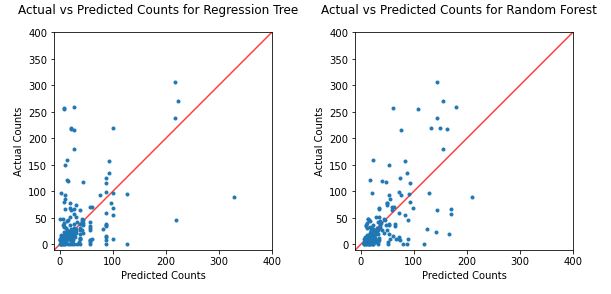
We see on both these graphs that the data sometimes falls well enough on the diagonal line, however there are a few observations that are pretty far away from that line as well. If you think that the random forest is tighter around the diagonal, you would be correct. In fact, the R-squared of the random forest is about .45, which indicates that there is a bit of predictive value!

Wish I could say this was good enough. Not only is this R-squared not particularly high***, but it also doesn’t paint a very good picture about the consequences of the model’s shortcomings. One metric that we can use to tell us about the relationship between the predicted and actual counts is the Mean Absolute Error, or MAE. This tells us the average amount the predicted value is off by. In the case of the random forest, the MAE is approximately 30. Think about it this way: if a tournament has 30 doubles but the MAE is 30, that means that on average, the predicted value for that tournament will be either 0 or 60– a 100% difference. Over 60% of tournaments in our data have 30 or fewer doubles.
I don’t even want to talk about the match-level doubles…
These are honestly some of the worst predictive models I’ve ever seen.
| ***What constitutes a “good” R-squared value is highly dependent on what you are trying to predict. R-squared values for models that try to predict human behaviors can be quite low and still be considered acceptable. I have worked in industries where a model with an R-squared as low as 0.15 is considered to be a decently predictive model. Just because a model has what looks like a low R-squared does not mean that it isn’t a useful model. |
Last Ditch Efforts
So, what’s next? Nothing I want to explain particularly in-depth, but I’ll go over the high-level attempts, which all ended in failure.
- Linear Regression Models – Even though the data doesn’t lend itself very well to a linear regression model, I tried it anyway.
- Negative Binomial Models – These are like Poisson models, except they are used when your data is overdispersed. Overdispersion occurs when the mean of your data does not equal the variance, which is the case with both the tournament-level and match-level data.
- Data Transformations – If your data isn’t the distribution you would like it to be, you can attempt to transform your data to turn it into a distribution that you can use with a particular model. Examples that you can attempt, where appropriate, are Log and Box-Cox transformations.
- Changing to Binary and Model Shenanigans – Because match-level data has such a high amount of matches with zero doubles, it seemed like a good idea to try modeling if a match would or would not have a double. If a match was predicted to have a double, a second model would be run on these matches to see if the count could be predicted. Unfortunately, none of the models worked for even predicting did/did not have doubles, so I didn’t bother with the second half.
Well, This Sucks
Clearly this shows that not everything can be predicted. There are many explanations for this: the correct variables to explain the pattern haven’t been found, the variables that can explain the pattern can’t be measured easily, the solution may be too complex, the right type of model may not have been used, among various other reasons.
I’m not quite ready to throw in the towel, and I’m especially not ready to tell Sean that he’s right. Seems like it’s time to do a little extra research so that maybe I’ll be able to figure out something that will save me from this horrible failure.