

The YouTube channel Turul HEMA recently posed a video attempting to derive the average number of double hits seen in HEMA longsword tournaments. (HEMA Longsword Double Hit Average (Updated)). The number reached was between 11.1% and 14.5%, based on the results from the 2018 Dutch Lion’s Cup. Naturally the biggest difficulty with this number is the fact that it represents data from only one tournament. Which begs the question, how well does this result map when applied to a bigger data set?
Using, as I always do, the HEMA Scorecard data we get some good opportunities as well as some challenges. Turul HEMA watched each match to get the final count, which is agonizingly slow but produces data with excellent integrity. The HEMA Scorecard data represents results entered by tournament organizers all over the world, and who knows what ruleset they were using or how their table was operating.
First Pass
Each tournament in the dataset can be categorized as:
- No Afterblow – Exchanges are entered as points for one fighter, or as a double hit with no score.
- Deductive Afterblow – Exchanges are entered as clean hits, afterblows with an initial hit and an afterblow, or as double hits with no points.
- Full Afterblow – Exchanges are entered with the points for each fighter’s hits. Therefore all doubles and afterblows are recorded as an afterblow.
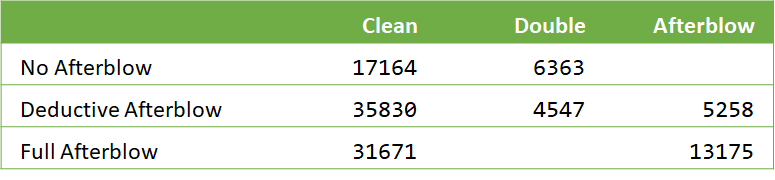
The Turul data was compiled in a deductive afterblow tournament, and only considering the double hits. Which means that any data from a full afterblow tournament is useless for our purposes. Crunching the remaining number for No and Deductive Afterblow tournaments we get:
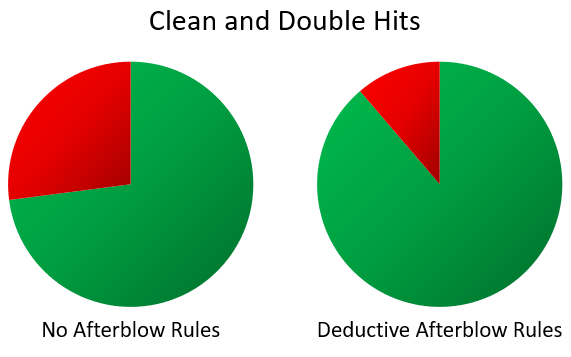
Whoa, what’s with the big discrepancy? Perhaps the event organizer in the No-Afterblow tournaments are just classifying all afterblows as double hits as well? Let’s do a quick check with our friend, the Bilaterals per Exchange (doubles + afterblows per scoring exchange)
One explanation is that the No-Afterblow doubles data represents both doubles and afterblows. Which then brings up why the number is so different between all the different tournament formats. (Which is a huge and complicated question all on its own.)
So for now, what we can glean is that we can’t consider them all as one data set.
Bell Curves
Things that exist naturally tend to follow a normal distribution, commonly known as the bell curve. This means that it is most common to see results near the average, and less common to see results far away from the average.
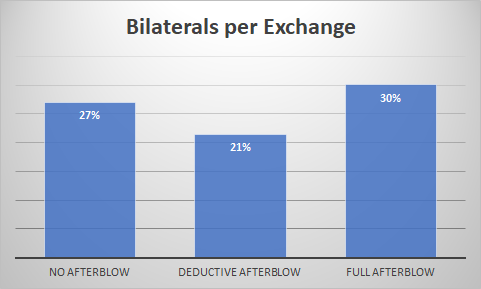
If we had a magical crystal ball that told us that the HEMA World Double Hit Percentage was 15%, we wouldn’t bat an eye at tournaments that had double hit percentages of 12%. But we would probably be shocked at one that had one of 29%. The Bell Curve is the ‘idealized’ form of this distribution. Below is some made-up data (blue), and a bell curve produced out of it (orange).
We can do the magic math to make a bell curve out of any data, but that doesn’t mean we should. The bell curve (and associated magic number ‘Standard Deviation’) only produce meaningful results when the underlying reality is in fact a normal distribution. Trying to pretend things are all representable by a bell curve can win you a nobel prize in economics, but I’m an engineer and people typically demand my models actually work.
First let’s have a look at the actual No Afterblow tournament data.
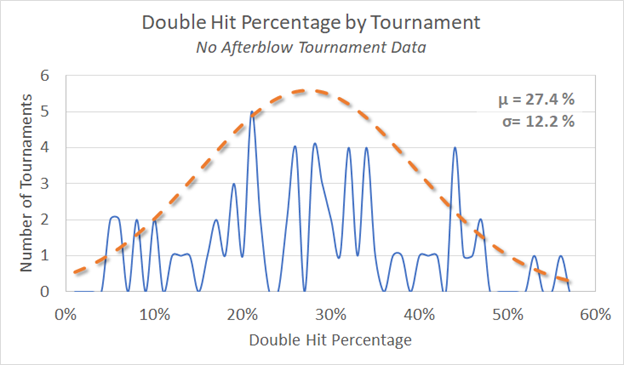
So for the No Afterblow tournaments the data is all over the map – no help here. Let’s have a look at the Deductive Afterblow Tournaments
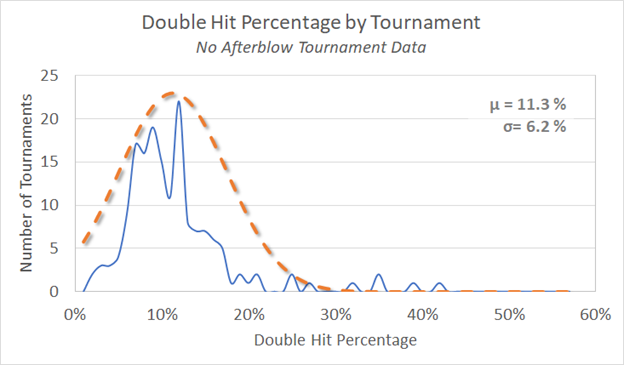
Now we have something that looks like it could be a normal distribution.
Individual Basis
The Turul HEMA video not only investigated the double hit percentage of the tournament as a whole, but the double hit percentage of fighters. So let’s do that. Pulling data from 1243 fighters, we get the following data.
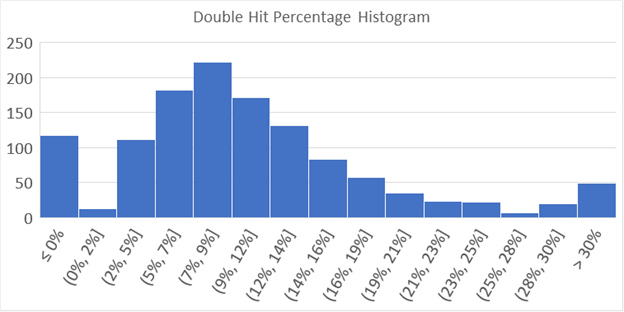
Notice that we see the number of double hits decline as we move from the peak towards the left, and then spike up at 0 percent? This is because you can’t get fewer than zero double hits, while the highest fighter managed a whopping 56% double hits (without including afterblows). There is an almost unlimited room to accrue more doubles, but zero is the bottom*.
It is common sense that the more matches you go through, the lower your chance of getting away with not a single double. It is also statistically accurate, something which doesn’t always jive with common sense.
However, having a bunch of people at zero exchanges is problematic. Because you can’t be lower we can’t tell the difference between people who would be at zero and people who should be at “ negative 10%”, so to speak. What we can do is lower the effect of randomness by adding a minimum exchange threshold. Applying a filter for only fighters with more than 30 exchanges helps clear up individuals who have a streak of good (or bad) doubles luck, and haven’t had a lot of exchanges to converge back to their true average.
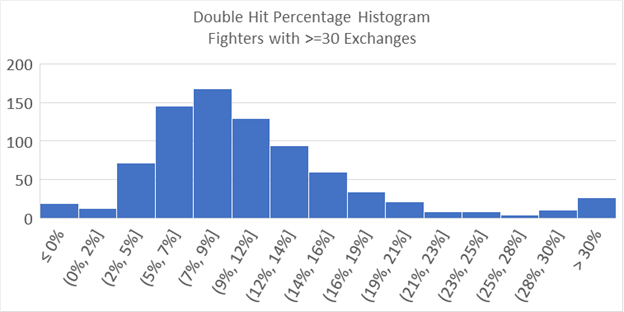
Nice, the curve looks much more manageable. And of course we know the bell curve works every time, so we just slap on an average and standard deviation and hit the pub…
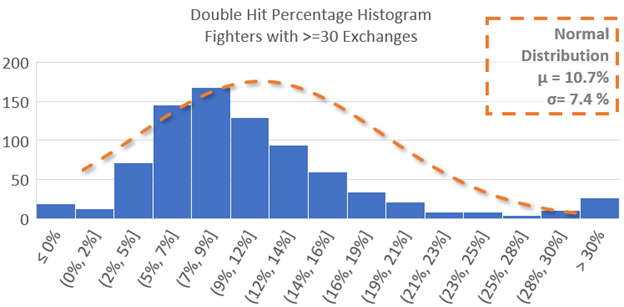
Uh oh. That bell curve doesn’t look like it fits at all. And the reason that it looks like it doesn’t fit, is because it doesn’t.
The bell curve (aka the normal distribution) assumes that everything is symmetrical about the average. What we see here is a long tail, the number of people with a high number of double hits trails of towards the high side rather than decreasing quickly as one would expect of a normal distribution. This is why the highest point from the two graphs doesn’t line up, the long tail of high double hits drags the average over to the right, away from the peak. (Remember back to grade school math, and how you couldn’t understand why your teacher made such a big deal about the difference between the mean, median, and mode.)
What are the implications of this? I’m not an expert stats guy, and I don’t know that digging into it will reveal anything interesting. So for now:
- The average double hit percentage is about 10.7%
- If you grab a random person they have the highest chance of having a double hit percentage of about 8.5%
- If you are an expert stats guy, drop me a line if you want to have a look.
Stuff For Nerds
Yes, I did just use a smoothed line plot as a histogram. Thank you for noticing.
* Having data cut off as you reach the upper/lower bound is also the reason why teachers tend to give exams that are too hard, and then bell curve the results up. If the test ends up being too easy you get a bunch of people stacked at 100%, and you can’t separate them even if you do curve the test down. A harder test with an average of about 50% produces a nice bell curve that can be moved up to wherever you want it to be**. It is much better to err on the side of too hard than too easy.
** Unless you are in a first year STEM program where they just let a whole bunch of you fail.