HEMA Competition Manager (HEMA CM) is a popular and widely used software for HEMA tournaments and represents a significantly different data set from the one I normally have available. The software’s creators, Carl Ryrberg and Björn Carlander, were kind enough to provide a data dump to study.
In the data sets I have used in the past, the majority of tournaments were deductive afterblow format. This is to say, landing an afterblow would simply decrease the point value of the initial hit, possibly negating it completely.
The majority of HEMA CM tournaments, on the other hand, feature a full afterblow format. In this format points each fighter is awarded points for the most valuable target they struck before hold is called. Which means that if Fighter A scores a 1 point attack, and Fighter B responds with a 2 point afterblow, Fighter B gains a point advantage in the exchange.
For starters, I am looking at Longsword data. This is because, like always, there is way more of it and therefore a much better sample size.
1&2 vs 2&3
There are two common point values assigned to low and high value targets. The first is 1 point for a low value target and 2 points for a high value target. The other is 2 points for the low value target and 3 points for the high value target. (Typically high value targets are cuts/thrusts to the head and thrusts to the torso. All other attacks are low value. But the rules can vary from event to event.)
The logic behind the 2&3 scoring is that it encourages fencers to land clean exchanges, rather than gaining points by being on the high side of bilateral hits and slowly accumulating leads with 2-1 exchanges. Which sounds like a noble intention, but it certainly isn’t as popular.
When I asked Carl why he preferred the 1&2 system he explained that ‘clean’ was not his main objective of the Nordic League rules (under which the majority of these tournaments were fought). Instead his goal was to encourage fencers to go for deep targets, and create more interesting fights. In a 2&3 system a defender can reduce their opponent’s point gain to 1 point by throwing an afterblow to the leg, which would be half the value of a 2 point geyslern or hand strike. The concern being that placing a disproportionately high priority on clean fencing will lead to fencers preferring to snipe shallow targets at a distance.
Bilateral Hit Percentage

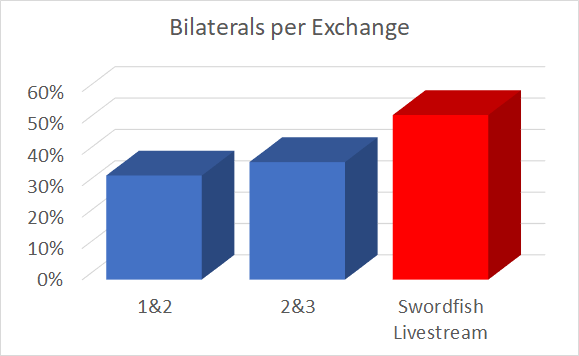
There isn’t a particularly notable difference between 1&2 and 2&3 scoring, 33% vs 38%, (overall a 15% increase in the number of bilateral hits for 2&3 scoring). Because this data is far from heterogeneous (the two rulesets were always used at different events, which naturally have slightly different attendance) I don’t know if this is significant enough to say that 2&3 leads to more bilaterals. But we can probably put to bed the idea that 2&3 produces fencing with fewer bilateral hits, the very reason for its conception.
Deep Target Percentage
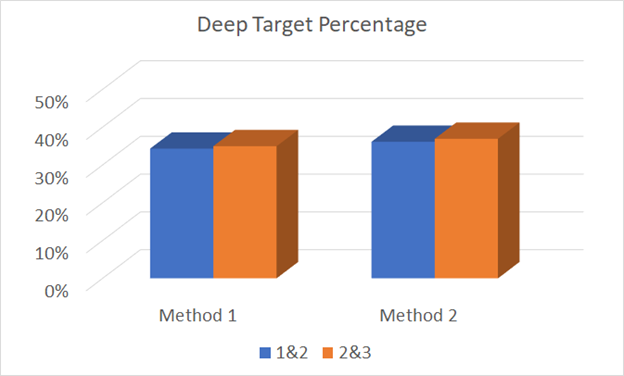
Organizers assign point values to targets to encourage certain behaviors and discourage others. Typically goals are to have fencers fight cleanly (see above) and to go for deep targets. Therefore the percentage of attacks which are awarded the high point value is fairly representative of the percentage of attacks which are directed at deep targets.
There are two ways of looking at this data. Do you consider an exchange with both fencers landing 1-1 as two shallow target hits, or one shallow target hit? I’m inclined to the former, but tried both to see if there was a difference.

There was not.
It is basically a wash in the deep target percentage between both point allocations. (I also don’t have the deep target percentages from the Swordfish Live Streams, and am not rewatching them all to add another bar to the graph.)
Conclusions
Essentially we’ve learned that 1&2 and 2&3 don’t make a big difference in the two biggest data metrics. But that doesn’t necessarily mean that they are interchangable; participant experience is something which often doesn’t correlate very well with the underlying numbers. For instance at Longpoint 2019 several competitors disliked the ranking algorithm because their perception was that it punished people who went in deeply, even though crunching the numbers proved that it wasn’t true.
Now, does the pressure applied by each of these allocations match what the organizers intended? Do the actual technical skills exhibited differ significantly enough to warrant one over the other? That ball is back in the subjective eye-of-the-beholder court.
- Thanks to Carl Ryrberg and Björn Carlander for providing the HEMA CM data, and all the hard work they put into the software to benefit the community.
- Thanks to Tim Magnuson for working with the data, because I’m incompetent with Microsoft SQL Server.
Stats for Nerds
One issue with the data was the number of 0-0 exchanges recorded. In most Full Afterblow tournaments this is not a valid exchange. Exchanges with no quality or judge agreement should be recorded as ‘no exchange’. Exchanges worth the same amount of points for each fencer (1-1, etc…) should be inputted as the exchange number. So it is basically impossible to tell what a 0-0 exchange is. As such I ignored this data and didn’t factor it into any of the calculations.
| Score 1 | Score 2 | Count |
|
1 & 2 |
||
| 0 | 0 | 1767 |
| 1 | 0 | 8890 |
| 1 | 1 | 2871 |
| 2 | 0 | 4492 |
| 2 | 1 | 2900 |
| 2 | 2 | 880 |
|
2 & 3 |
||
| 0 | 0 | 370 |
| 2 | 0 | 2560 |
| 2 | 2 | 958 |
| 3 | 0 | 1320 |
| 3 | 2 | 1074 |
| 3 | 3 | 294 |

