

Combat Con 2022 had a hot take on how to run a longsword tournament: eliminate self-selection of skill level and, instead, have people fight in preliminary pools to get placed into different tiers based on their performance. The true reasoning behind this remains a mystery, but we’ll just pretend that the guys at Combat Con wanted to do something that involved more math than your typical event. Because who doesn’t like turning something as simple as self-selection into a more statistically-sound method?

How It Worked
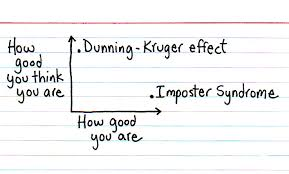
Many tournaments that have different levels of longsword (or other weapons) allow fighters to self-select their skill. The idea is that people who believe they are beginner-level will enter into the lowest tier of skill available to them whereas people who have a track record of winning will enter into the most advanced tiers of the competition. Though I would like to believe that most people have honor and will enter themselves where appropriate, I have heard tales of people sandbagging the competition, and I’m sure there are also folks out there with imposter syndrome who place themselves in lower tiers because they don’t feel worthy of the higher ones (and maybe a small handful of folks experiencing the Dunning-Kruger Effect).
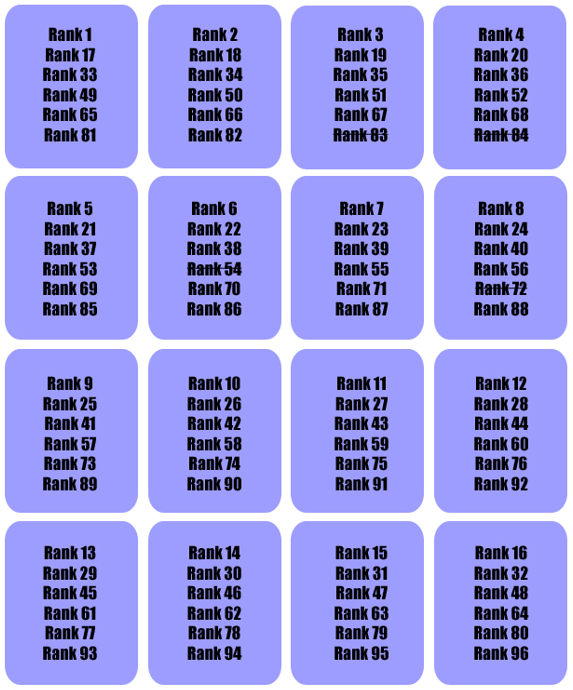
Combat Con, instead, decided to divvy up their 94 longsword entrants into 16 different pools, some with six fighters, others with five (each was supposed to have six fighters, but a couple people dropped). At first, I thought that the pools were split randomly, however they were not. They used HEMA Ratings to decide the pools through what Combat Con organizers are dubbing the “Ladder Method”. This method divides competitors evenly across pools based on their skill by ordering the competitors from greatest to least skill and placing them sequentially in pools. Being that there were 16 pools in this fight, that means that the top competitor in the pool was ranked 16 spots higher than the next highest ranked competitor in the pool, 32 spots higher than the third highest, and so on. The pools looked roughly like this, with slight variations so that fighters from the same school were not in the same pools (some fighters are crossed out because they dropped):
After pool matches concluded, rankings were established based on how well people fought during their pools. The top third, middle third, and bottom third of the rankings were each separated into different tiers of skill, and elimination brackets were devised within each of these tiers.
Did The Tiers Make Sense?
Probably the biggest question is how well they matched up with where we would expect them to fall based on their HEMA Ratings. After all, the pools were split in such a way that it should ensure the highest-ranked HEMA Ratings fighter wins all their matches.
To look at this graphically, we can take a look at this Sankey Diagram below. This graph shows which tier each fighter was expected to have ended up on the left and the tier they actually ended up in on the right. This takes the 63 fighters who have HEMA Ratings and breaks them up into tiers of 21 people; any fighters that are brand new to the tournament scene for mixed steel longsword are not included.
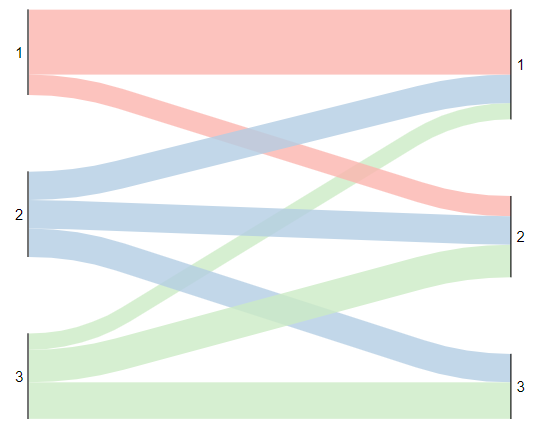
From this diagram, we can see that quite a few people did not end up where they belong. If everyone predicted to be in tier 1 ended up in tier 1, we would see all of the red line moving directly across from category 1 on the left to category 1 on the right. Instead, we see some of the fighters drop down into category 2, as well as fighters from categories 2 and 3 jump up to category 1. If you want specific numbers, only 51% of the fighters (32 of 63 ranked fighters) ended up in the tier they were expected to fall in. We can have this tabular format, with the numerator being the count in the diagonal:
| Actual Tier 1 | Actual Tier 2 | Actual Tier 3 | |
| Expected Tier 1 | 16 | 5 | 0 |
| Expected Tier 2 | 7 | 7 | 7 |
| Expected Tier 3 | 4 | 8 | 9 |
If we want to look at it slightly differently, we can also add in the unranked fighters. These are fighters that we would assume would self-select the beginner-level tournament, or lowest-tier tournament, because they do not have any prior tournament experience (at least not in mixed steel longsword, for this analysis). This brings us up to 92 fighters, with 31-ish fighters per group. That causes the rankings to shake out as follows:
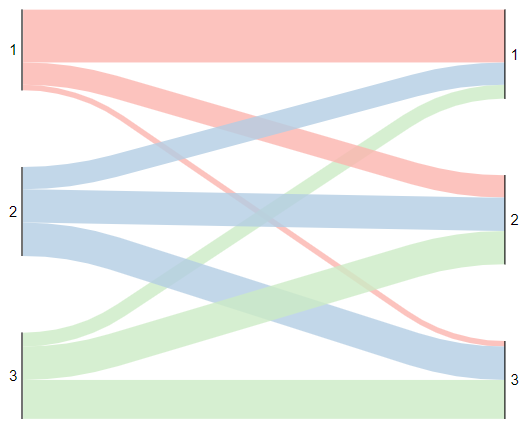
We see much of the same thing that we saw with the first graph when we include tournament n00bs. People are not getting into their expected tier, with even some people going as extreme as dropping from first tier down to third tier. Adding in the unranked fighters causes the accuracy of this method to drop just slightly down to 47% of fighters making it to their expected category.
| Actual Tier 1 | Actual Tier 2 | Actual Tier 3 | |
| Expected Tier 1 | 20 | 9 | 2 |
| Expected Tier 2 | 7 | 11 | 14 |
| Expected Tier 3 | 5 | 12 | 12 |
Editors Note: If you keep reading “Snakey Diagram” you’re not alone.
What The Heck Happened?
Only about half of the individuals made it to their expected tiers regardless of how you look at the data. This is especially interesting considering that pools were not set up in a random fashion, but rather set up to where you’d expect the tiers to shake out in a much more predictable fashion. How can we explain this?
While the running joke was that people were going to intentionally lose their matches in order to be placed in lower tiers, I’m placing my money that the issue revolves around sample size. Sample size is the number of observations out of the total population that you are using for an experiment. In the case of a tournament, the total population would be the total possible number of unique matches among all participants.
Because there were 92 total fighters in this tournament, this means each fighter would have 91 matches; when you eliminate duplicates (Fighter 1 against Fighter 2 is the same as Fighter 2 against Fighter 1), this is a total of 4,186 matches. This is obviously a prohibitive number of fights when you consider both tournament run time, equating to about 26 hours of fighting if your fights are capped at 90 continuous seconds with 4 simultaneous rings running at all times. Also, fighting 91 matches sounds exhausting.
This is where sample size comes in. You don’t have to run through every single match to be reasonably sure that your results reflect reality. There are statistical formulas for determining what the appropriate sample size should be, and in the case of Combat Con, there should have been about 352 individual matches in order to have decent confidence in the rankings. In this tournament, there were only 225 individual matches. In order to get to the 352-match threshold, event organizers would have needed to create eight pools of nine fighters and two pools of ten fighters (for a total of 378 matches). This brings down the above estimates to either eight or nine matches for each fighter, which is about 4.4 hours of tournament time if running 4 simultaneous rings (utilized Sean’s handy-dandy tournament time calculator to get these figures).
Additionally, there isn’t even a good way to tell if the winners of each of these matches should be the true winner. Though the entire population of exchanges is used to determine who wins the match, these matches were limited to a maximum of 3 exchanges, or a maximum of 9 points among all exchanges. In statistics, the magical number for a sample size when using the entire population is 30. While I’m not advocating for 30 exchanges (or playing to a combined 30 points for that matter) from a practical perspective, 3 exchanges is a far cry from creating a representative showing of how two fighters compete against each other.
Maybe HEMA Ratings Isn’t Accurate…
Yeah, what about the accuracy of HEMA Ratings? Surely part of the reason why Combat Con’s ranking system didn’t work out as expected is because HEMA Ratings isn’t completely accurate, right?
Using the idea of sample size, let’s take a look. Right off the bat there is a problem with using HEMA Ratings data because about a third of the fighters in this tournament had no data in HEMA Ratings. Of the 63 fighters that did have data, only 20 of them had data from at least 30 matches, with the average number of matches for these fighters being 28 and the median being 15. Here’s a histogram for the number of matches each ranked fighter has:
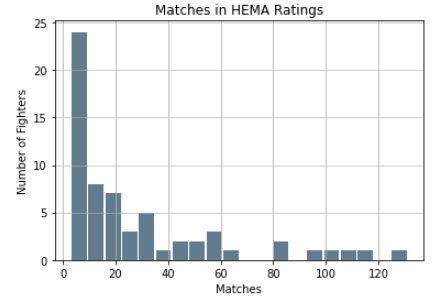
This graph doesn’t really inspire a lot of confidence that HEMA Ratings is extremely accurate, given that over a third of the ranked fighters have their rating based off of five or fewer matches. However, this is the best data source we have for rating fighters.
Note to event organizers: submit your data to HEMA Ratings so that I can do more fun stuff with it!
Last Thoughts: Eliminations
We saw a lot of shake-ups in the way the talent pool was spread across the tiers, so let’s have a look at how the different tiers ended up after finals brackets. I am going to use the data that includes the unranked fighters for this next part.
For Tier 1, all three of the medalists as well as the fourth-place competitor were expected to have been in Tier 1. Additionally, only those that were expected to be in Tier 1 made it past the second round of eliminations for this Tier. There were 5 individuals who were expected to place in Tier 3 that made it to Tier 1; four of the five lost the first round of eliminations, and the final Tier 3-expectant lost in the second round of elims.
Tier 2 was a little less clean than Tier 1, however some of the results were pretty much expected. For those who made it to the gold and bronze medal matches, three of them were expected to have been placed in Tier 1, with the last medalist being a newcomer without a rank.
Tier 3 also ended up pretty much as you would expect it. Two folks that were allegedly destined for Tier 1 ended up in this section, and both of them took home medals. The other medalist as well as the fourth-place finisher in this tier was expected to have ended up in Tier 2.
Thank You To…
Thanks Combat Con for taking a novel approach to running tournaments. Other events have also used this method, but not on such a large scale. Also, a shout-out to James Conlon for providing me with much of the data that was used for this analysis; it’s always great to be given a clean and well-formatted data set rather than having to collect the data on your own and/or make it digestible by Python.