

I was asked an interesting question. Is there such a thing as home field advantage in HEMA tournaments? And of course I became very curious to see what the numbers tell.
What is Home Field Advantage?

Home Field Advantage (HFA) is a sports term used to describe a phenomenon where the local team (home) has an advantage over teams from out of town (away). Explanations that have been proposed are:
- The away team has to travel and stay at hotels whereas the home team can be relaxed in their normal lifestyle.
- The home team has the support of the crowd, and can use the energy to elevate their performance.
- The home team is more familiar with the sports venue.
- The officials/organizers are biased.
This can be a real or imagined phenomenon, in some cases statistics don’t exactly show a strong bias either way. It also tends to vary significantly from sport to sport but in a lot of cases it does exist.
Home Field Disadvantage?
At first the idea of HFA in HEMA is a bit laughable to me. I have often joked with event organizers about the ‘Host Club Penalty’.
If you weren’t aware*, hosting HEMA events takes a lot of work. It tends to require a lot of volunteer investment from the host school, and in the case of larger events it likely draws from other local groups. So rather than relaxing on focusing on their matches they are running around making sure that everyone else can relax and focus on their matches. Putting in hours and hours of judging doesn’t exactly help your performance.

* And now that you are, make sure to express your gratitude to the organizer of the next event you attend.
So my initial reaction would be that home field is actually a bad thing to have.
Methodology
This was done the simplest way I can think of, based on nationality. This is far from perfect (I’ll get in to the flaws once I’m done), but it’s a start. And this data already exists. Matches that I am considering include:
- Two fighters of different nationality
- One of the fighters is a national of the country that the event is being held in
- Only countries that have over 50 home and 50 away matches.
Once again I turn to the HEMA Ratings data as a source. Though it’s undoubtedly not a perfect assessment, it’s by far the most comprehensive data source in HEMA.
Thanks to HEMA Ratings for providing me this information!
First Pass
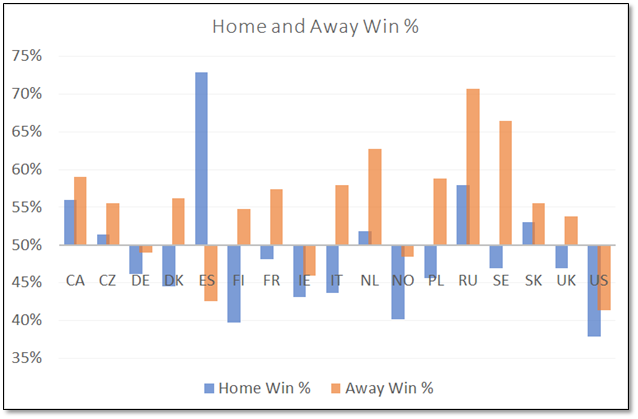
What do we see here? On first pass it definitely doesn’t seem like there is a HFA. Let’s compare home and away.
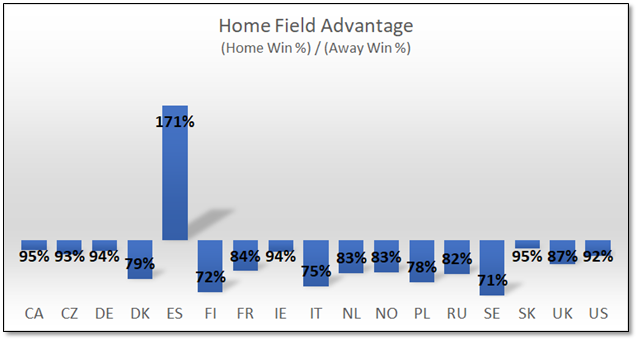
So just about EVERYBODY does worse when fighting international fighters on their home turf. Except the Spanish. They completely rock at home.
But there is one major thing that this data neglects. And some stats nerds might be screaming at their computers already. That is the Quality of Competition.
Quality of Competition
It’s no secret that fencers who are more experienced are more likely to travel. Whereas local fencers are more likely to come from a broad range of skills. So if you have a highly experienced international competitor thrown in to a pool with a number of inexperienced locals, what do you think is going to happen?
So let’s have a look at the data with factoring in participant skill. To do this I will be using the mathematical model I created in my article HEMA Ratings – Does it actually mean anything?. And to repeat the conclusion I reached: The rating score of HEMA Ratings is a fairly good predictor of match success on average, and a decent probability function can be generated based on the ranking difference between two fighters.
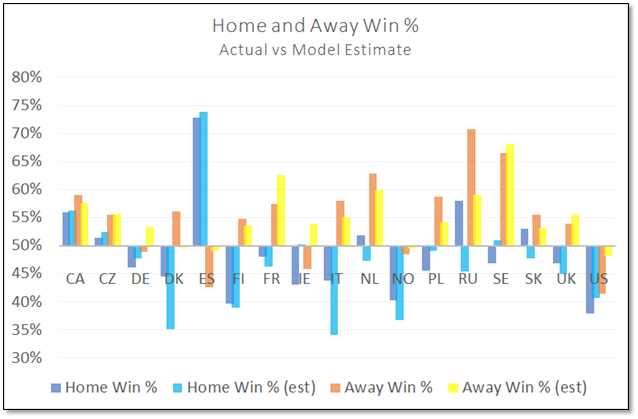
In this plot you can see the actual win percentages compared to my estimate of what they should have been, based on the HEMA Ratings of the fighters.
For instance, we can clearly see that while the Spanish enjoy great success fighting on their home turf, they are also expected to do so. This means that most of these victories can be attributed to higher rated Spanish fencers facing lower rated international fencers.
Likewise the Swedish enjoy a significant success fighting abroad. But that is also likely because they have highly rated fencers competing abroad.
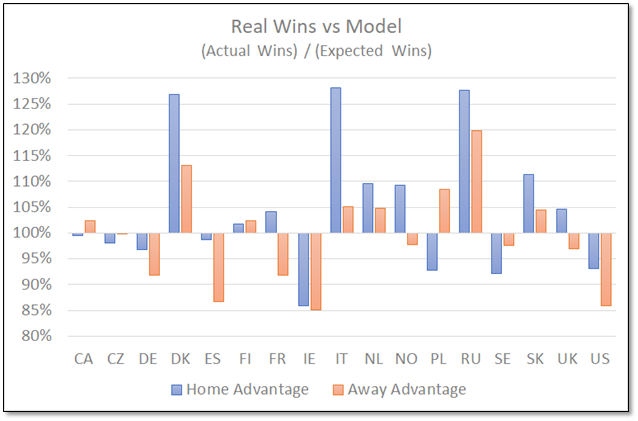
This is a graph that shows the percentage difference between what my model predicts and reality. We can only jump to so many conclusions, after all this is all predicated on:
- The HEMA Rating being a good reflector of the fighter’s abilities.
- The modeling function matching the actual win probability.
Because of that, I wouldn’t call most of these results significant. A few percentage points is easily just noise in the model. To highlight some interesting observations:
- Most countries tend to match the HEMA Ratings model without too much discrepancy.
- Polish fencers tend to match the HEMA Ratings model overall, but underperform in Poland and over perform internationally.
- Irish fencers tend to perform worse than what the HEMA Ratings model would suggest, both at home and abroad.
- Russian fencers tend to perform better than what the HEMA Ratings model would suggest, both at home and abroad.
- Italian fencers tend to match the HEMA Rating model when competing abroad, but massively outperform the model when competing in Italy.
- Danish fencers tend to outperform the HEMA Rating model, but to a higher degree when competing in Denmark.
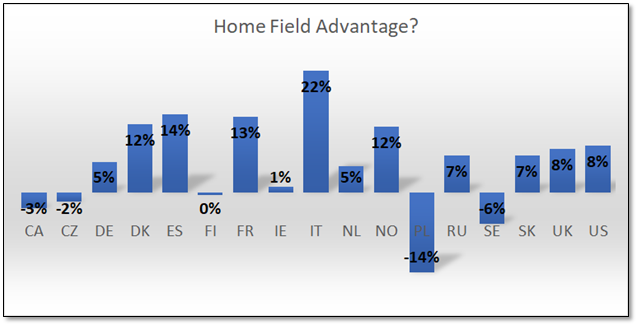
You shouldn’t read too much into this. It’s constructed on assumptions layered on top of other assumptions. But the trend does seem to be towards fencers performing better at home.
Everything wrong with what I just did
There are a few things that can cause problems, and there are probably more that I haven’t listed here.
Inaccuracy in the HEMA Ratings & Model
The whole Quality of Competition adjustment I used hinges on the HEMA Ratings being an accurate reflection of a fighter’s win probability. While I think this is a justified assumption based on my past investigation, there is going to be a lot of variability.
International Dissimilarities
This analysis treated each country as a monolithic entity, and in many cases that is just simply not true. You can have countries that are more divided internally than some countries are externally. The United States has enough HEMA sub-regions that it could easily count as several European countries.
International Similarities
While there are differences within countries there are also similarities between countries. Countries within the Nordic Historical Fencing League will be much less ‘international’ when competing against each other than when competing against countries from outside the NHFL. This isn’t addressed at all in the data. While I can pull the NHFL out without too much difficulty it isn’t so simple when using fencing cultures which are influenced by each other, but not explicitly connected. Where do you draw the line?
Home Field Disadvantage
This was based on country, not school. I’m willing to bet the majority of fencers who are attending a competition in their home country are not actually in their hometown. So they are also ‘away’ in that sense. And since we can’t separate the event hosts from the out-of-town-in-country participants it doesn’t really tell us much about the Home Field Disadvantage I mentioned earlier.
So don’t read too much in to this!
This was mainly just for fun and curiosity. Hopefully you were sufficiently entertained, even without illustrations of stick people being maimed and injured.
Stuff For Nerds
So here you are, ready to rip this apart. Please refer to the above about me writing for fun and curiosity. While I could have gone really hog-wild and done thesis level analysis on this, I don’t feel like spending the effort. If you are concerned that it isn’t rigorous enough I would highly invite you to prepare some superior data. I’m always looking for new contributors, put your money where your mouth is! 😀
Model Function
The model function I was using, based on the previous article is:
[Win %] = 1- 0.5 * e^( – [Rating Difference] / 370 )
To calculate the quality of competition I had the win probability of each match calculated based on the fencer ratings, in decimal form. I kept a running tally of these fractional wins, adding to a total number of expected wins at the end. For instance, given estimated win percentages of (0.35, 0.5, 0.76, 0.4, 0.34) I would come up with an expectation of 2.35 wins in those 5 fights.
Raw Data
| Country | Home Win | Home Loss | Home Expected Wins | Away Win | Away Loss | Away Expected Wins |
| CA | 33 | 26 | 33.2 | 558 | 388 | 544.8 |
| CZ | 148 | 140 | 150.9 | 349 | 280 | 349.7 |
| DE | 24 | 28 | 24.8 | 116 | 121 | 126.3 |
| DK | 41 | 51 | 32.3 | 105 | 82 | 92.9 |
| ES | 137 | 51 | 138.8 | 134 | 181 | 154.7 |
| FI | 208 | 316 | 204.3 | 342 | 282 | 334.3 |
| FR | 277 | 299 | 266.1 | 331 | 246 | 360.8 |
| IE | 75 | 99 | 87.3 | 106 | 125 | 124.6 |
| IT | 302 | 389 | 235.7 | 353 | 256 | 335.6 |
| NL | 325 | 302 | 296.6 | 398 | 236 | 380.1 |
| NO | 162 | 241 | 148.3 | 480 | 511 | 490.7 |
| PL | 98 | 117 | 105.6 | 361 | 253 | 332.8 |
| RU | 51 | 37 | 39.9 | 500 | 207 | 417.4 |
| SE | 1107 | 1254 | 1201.6 | 559 | 282 | 572.8 |
| SK | 582 | 515 | 522.9 | 180 | 144 | 172.4 |
| UK | 602 | 681 | 575.8 | 337 | 289 | 347.6 |
| US | 715 | 1174 | 768.2 | 98 | 139 | 114.1 |