

I was doing the pool seeding for a Messer tournament, and I ran into a problem that is all too familiar to organizers: what happens if a participant doesn’t have a HEMA Rating for the weapon you are trying to seed?
Normally in something like Longsword this is less of an issue, if they don’t have a rating it most likely means they don’t have experience and can safely go in as a low seed. Occasionally this assumption is violated, but on the whole it’s a pretty safe bet to plan your tournament tiers around. When it comes to single handed, it gets a little dicier. Because of the diversity of single handed weapons it’s very possible that someone could be quite experienced yet not have a rating in the category of interest.
For example, consider someone without a Rapier and Dagger rating. This may be because they are a newbie who has never competed – so are unlikely to be that good. But if you see they are highly rated in Single Rapier you can assume they are going to have a decent level of transferable skill, and perform significantly above someone who has never competed at all. And the odds that you have unrated fighters performing at a high level increase when you are working with a more obscure weapon like messer.
Indeed it does! It’s a ‘secret’ rating category that you can see here.
Before we go on, let’s take a moment to appreciate how much we take for granted the fact that we have a fully accessible database of seeding information from almost everywhere in the world. Hats off to HEMA Ratings once again (who also helped me collect information for this article).
How To Derive
My method is going to be simple: take all the ratings data, put it in a scatter plot, and do a linear extrapolation.
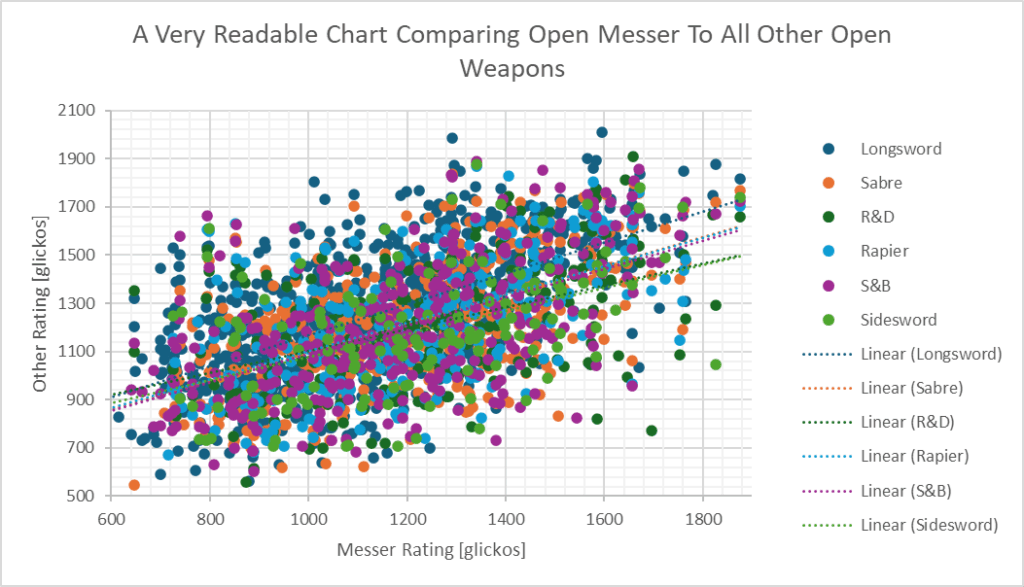
That plot was about as unhelpful as expected, so let’s break it down to just one weapon. And for probably the first time in the history of SwordSTEM, I’m not going to start with the Longsword data. Instead let’s compare the Messer ratings to the Sabre ratings.
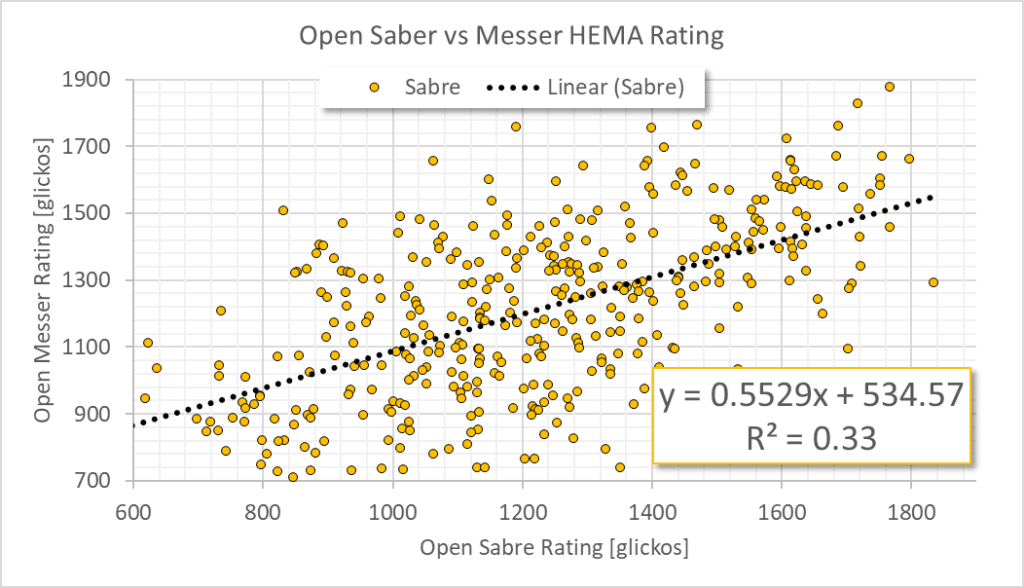
The first thing you may have noticed is that I flipped the axis. This is because the x-axis is what we typically call the independent variable, and the y-axis is the dependent variable. To simplify, most graphs are done so that in the future if we have a known x-axis, we can use the relationship in the graph to calculate the value of y. In this case we want to establish a relationship where if we know the Sabre rating (x-axis) we can then approximate a Messer rating (y-axis).
The numbers in the bottom right tell us two things. The first is the linear approximation of the relationship between the Sabre rating and the Messer rating. The formula Messer = 0.55 * Saber + 535 will give an approximation of the Messer rating.
The second number is the Coefficient of Determination, which sounds fancy but it is commonly just referred to as R2. Without getting too bogged down in the details, this number tells us how closely the Saber and Messer ratings map to each other. A value of 1 would mean that you can scale between them with 100% accuracy, whereas a value of 0 would mean that the two data sets are completely unrelated. A value of 0.33 is not particularly great, and says that while there appears to be some relation, we can’t count on it to be all that reliable. Which makes a lot of sense given the spread we see in the data. But of course we need to approximate using something. So it’s good enough for me.
Longsword and Messer
While it was groundbreaking that we didn’t use Longsword data as the example, it didn’t last for long. Let’s use it now!
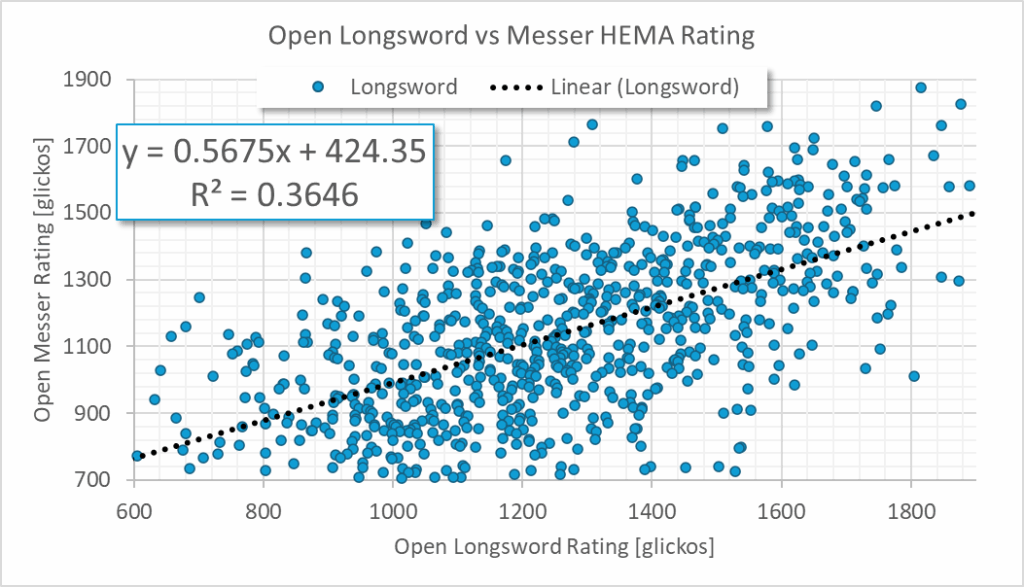
This is a fairly similar looking graph, which is not exactly surprising. What is interesting is that not only is the Longsword data not worse at predicting the Messer rating, it’s actually (slightly) better! Which is good news, because it’s far more common to have a Longsword rating than a Sabre rating.
Other Weapons
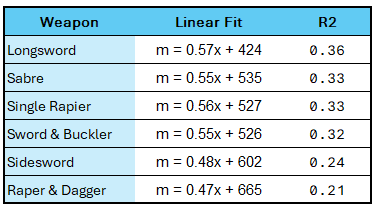
I’m not going to go through and show the plots for the other weapons, because they are basically what we have seen twice already. Instead you get them in the nice chart below, ordered by the highest to lowest correlation. Longsword is still at the top, because of course it is.
Conclusion, Or Why It Was Silly To Even Look At Non-Longsword Data
So does this suggest that Longsword is actually the best at predicting Messer skill, and Sidesword is somehow a way worse indicator? Not necessarily. An important distinction we need to keep in mind is that we have been correlating Longsword HEMA Rating to Messer HEMA Rating. Which is a different thing than correlating Longsword Skill to Messer Skill. HEMA Ratings (or more specifically the Glicko-2 algorithm) is an attempt to make a prediction on how well someone will do in the future based on how well they have done in the past. So rather than directly measuring “skill” the algorithm is making its best prediction of “skill” based on the historical data that has been fed in.
I suspect that most of the noise and low correlations are a result of a lot of people having very few matches. We opened this article with a discussion of how seeding Messer is difficult because it isn’t as common and there is less data – this doesn’t go away when we start making big blobby graphs, the lack of data is still a problem. If you’ve only done a few messer matches, you may have a rating that isn’t all that reflective of where it should be, and the model suffers accordingly. The reason Longsword was the most accurate correlation… is probably just because there are more Longsword matches in the system and therefore most people have a more stable and accurate Longsword rating.
Which is a good enough conclusion for me, as what I really wanted was the ability to seed people in Messer, and being able to use Longsword data was the most convenient thing I possibly could have done. So, despite the correlation being weak in a statistical sense, the goal has been achieved.
Post Script: Practical Notes
Last year I also faced a similar problem, but wasn’t so diligent about solving it. So I used the approximation of Messer Rating = 0.8 * Longsword rating. How did I arrive at this?

Given I just used my intuition, how close was I?

Actually pretty good I have to say. Which seems weird, because it’s consistently under-estimating the linear regression we just did. But that is by design, because if I have to estimate for a tournament, I want to under-estimate. If someone doesn’t have a messer rating I want them to have a comparative seeding disadvantage to someone who went out and got a messer rating, so I’m pretty happy with what I’m seeing here.
(For this year I ended up not using the 0.57x + 424 from the data, but instead lowered the calculated rating by ~10%, to under-estimate for the reasons I mentioned above. The final, simplified, formula used was Messer = 0.5x + 400.)